Figures & data
Table 1 General characteristics of study sample
Table 2 Mean age of subjects in the three age-subgroups
Table 3 RR interval and QT dynamics data according to age and presence of chronic heart failure
Table 4 QT variability indices according to age and presence of chronic heart failure
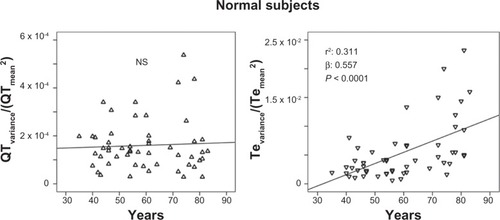
Figure 1 Relationship between QT variability index (QTVI) or Tpeak-Tend variability index (TeVI) and age in healthy control subjects.
Abbreviation: QT, from the Q wave to the T wave end.
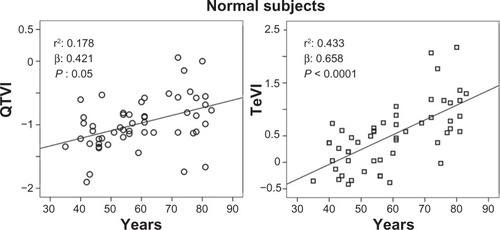
Figure 2 Relationship between age and ratio of short-term QT or Tpeak-Tend (Te) variability (STV) and resting rate (RR) variability indices, calculated on 60 consecutive beats (QT/RR STV60, Te/RRv STV60) or on 5-minute electrocardiogram recordings (QT/RR STVT, Te/RRv STVT) in healthy control subjects.
Abbreviations: QT, from the Q wave to the T wave end; v, variance.
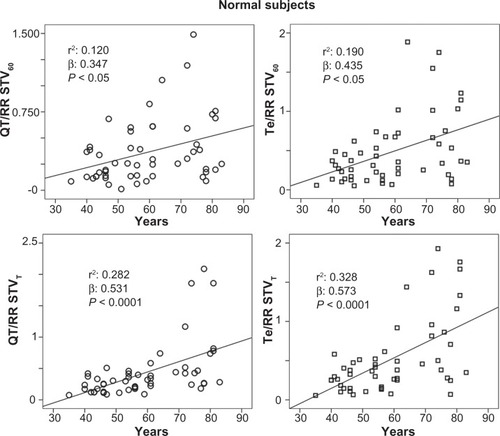
Figure 3 Relationship between age and the resting rate (RR) variability indices (ratio denominator of QTVI, TeVi, and short-term variability [STV], see Methods section), calculated on 5-minute electrocardiogram recordings (RRvariance/RRmean2 and RR STVT) or on 60 consecutive QRSs (RR STV60) in healthy control subjects.
Abbreviations: TeVI, Tend Variability index; Q-T, waves interval.
![Figure 3 Relationship between age and the resting rate (RR) variability indices (ratio denominator of QTVI, TeVi, and short-term variability [STV], see Methods section), calculated on 5-minute electrocardiogram recordings (RRvariance/RRmean2 and RR STVT) or on 60 consecutive QRSs (RR STV60) in healthy control subjects.Abbreviations: TeVI, Tend Variability index; Q-T, waves interval.](/cms/asset/738b5785-a5a6-425c-8a17-2655e85aa4c5/dcia_a_41879_f0003_b.jpg)
Figure 4 Relationship between age and Te variance/Te mean2 (ratio numerator of Tpeak-Tend variability index, see Methods section).