Figures & data
Table 1 Baseline characteristics of participants and dropouts (n = 15)
Table 2 Changes in mobility and muscle strength in ten participants who completed the resistance training program
Figure 1 Individual improvement of mobility score on the Elderly Mobility Scale before and after training intervention for women (n = 6) and men (n = 4).
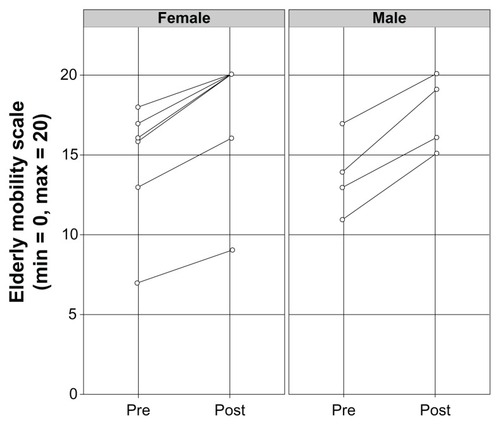
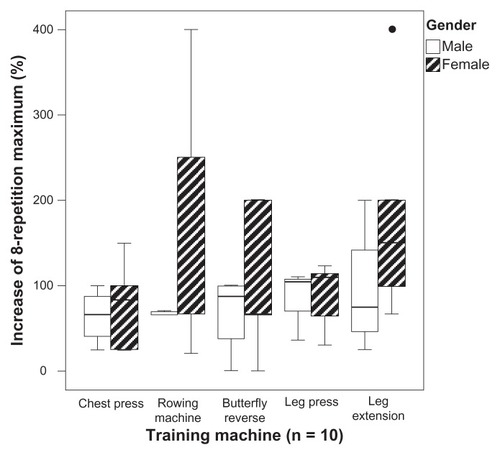
Figure 2 Comparison of percentage increase in eight-repetition maximum for each training machine for male (n = 4) and female (n = 6) study participants.
Notes: Horizontal line in the box represents the median; lower and upper end of the box represents the 25th and 75th percentile, respectively; maximum length of each whisker represents 1.5 times the interquartile range; dot represents the outlier.