Figures & data
Figure 1 Schematic representation of the CADi validation process.
Abbreviation: CADi, Cognitive Assessment for Dementia, iPad version.
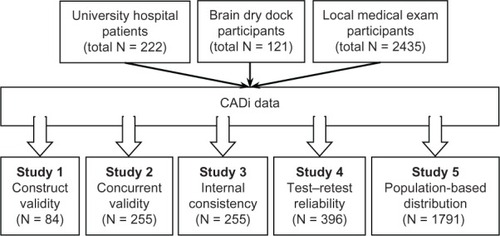
Table 1 Demographic characteristics and cognitive scores of the participants
Table 2 Correct response rates, weighted coefficients, reaction times, and Cronbach’s alpha for each Cognitive Assessment for Dementia, iPad version item
Figure 2 Comparisons of CADi scores (A and B) and total reaction times (C) for dementia patients and healthy elderly controls. (D) Receiver-operating characteristic curve for each score and time.
Abbreviations: CADi, Cognitive Assessment for Dementia, iPad version; wCADi, weighted CADi.
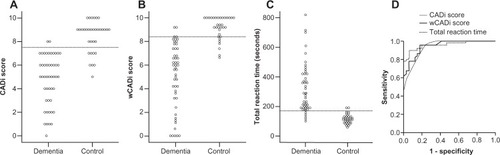
Figure 3 Scatter plots for CADi and MMSE scores.
Abbreviations: CADi, Cognitive Assessment for Dementia, iPad version; MMSE, Mini-Mental State Examination.
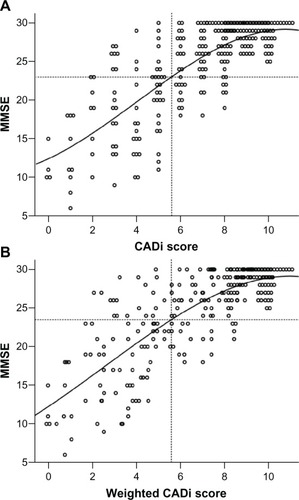
Figure 4 Scatter plot of first and second CADi scores separated by one-year interval.
Abbreviation: CADi, Cognitive Assessment for Dementia, iPad version.
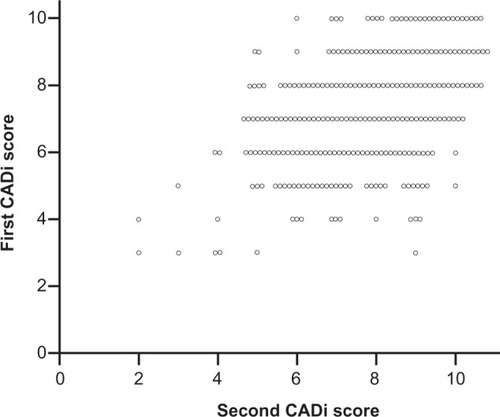
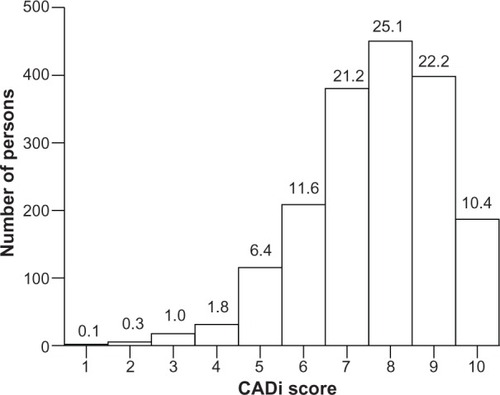
Figure 5 Frequency distribution of CADi scores for elderly people (65 years of age or over).
Note: Numbers on each column are percentages of individuals who obtained each score.
Abbreviation: CADi, Cognitive Assessment for Dementia, iPad version.
Abbreviation: CADi, Cognitive Assessment for Dementia, iPad version.