Figures & data
Table 1 Perioperative Parameters of Patients
Table 2 Results of Correlation Analysis of HBL and Independent Samples t-Test for Different Counting Data Groups. Data are Expressed as Mean ±SD *P<0.05
Table 3 Results of Various Measurement Data and Pearson Correlation Analysis in the Perioperative Period of Patients. Data are Expressed as Mean ±SD, *P<0.05
Table 4 Multiple Linear Regression Analysis of Risk Factors of HBL After THA. *P<0.05. Multiple Linear Regression Analysis Adjusted for All Variables in the Table. Adjusted R2 =0.319
Figure 1 The nomogram constructed using HBL = 1000 mL as the predicted outcome in overweight and obese patients after THA. The model involves five factors: diagnosis, hypertension, operative time, preoperative erythrocytes, and preoperative D-dimer levels. The number of points for each of the five indicators on the top dotted axis of the nomogram are summed to obtain the total points, which corresponding to the bottom axis regarding probability that the patient will reach 1000 ml of HBL after THA. For example, Patient A had the following results: a diagnosis of femoral head necrosis, hypertension, preoperative RBC: 4.63, operative time: 75 min, preoperative D-dimer level: 0.51 (all marked with red dots in the graph); the final sum of each score is 221, which corresponds to a 39.8% probability of reaching 1000 ml of HBL postoperatively in this patient.
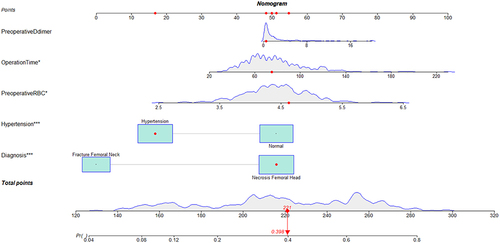
Figure 2 The ROC curve of HBL>1000ml in overweight and obese patients after THA. (A) The area under the curve was 0.758 and the confidence interval is 0.707 to 0.809 in training group; (B) The area under the curve was 0.736 and the confidence interval is 0.653 to 0.819 in validation group.
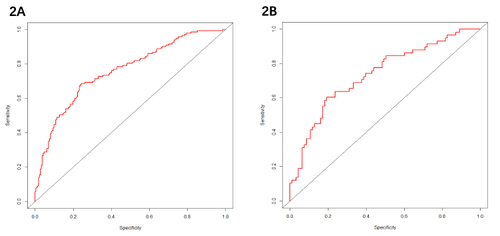
Figure 3 The calibration curves for the prediction of HBL>1000ml in overweight and obese patients after THA. (A) the training group; (B) the validation group.
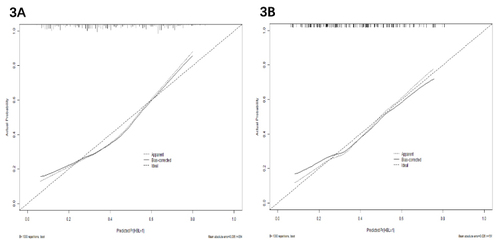
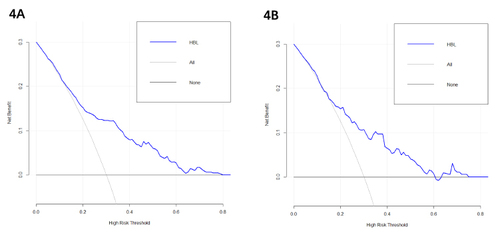
Figure 4 The DCA of the nomogram for the HBL prediction in overweight and obese patients after THA.