Figures & data
Table 1 Baseline Characteristics of Participants
Table 2 Logistic Regression of Associations Between the 4 Models and 1-Year Mortality Risk
Table 3 The Performance of 4 Prediction Models in Predicting 1-Year Mortality
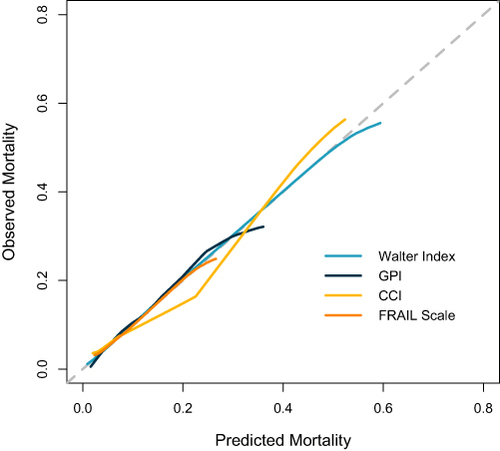
Figure 1 Distribution of calculated risk scores and the relationship between observed and predicted 1-year mortality.
Notes: The columns show the percentage of patients in different subgroups, and the lines show the 1-year mortality, with the green line is the observed mortality and the orange line is the predicted mortality. Sub-figures A–D represent distribution of calculated risk scores of the Walter Index, GPI, CCI, and FRAIL Scale and the relationship between observed and predicted 1-year mortality, respectively.
Abbreviations: CCI, Charlson Comorbidity Index; GPI, Geriatric Prognostic Index.
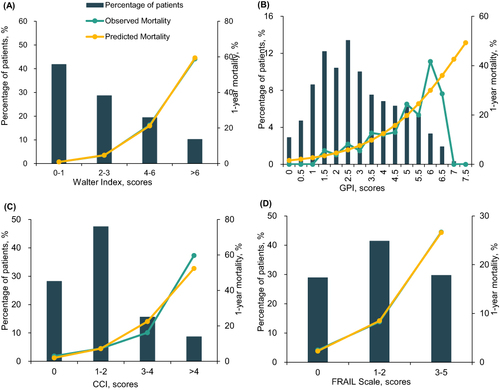
Figure 2 Calibration plot for 1-year mortality.
Notes: Calibration plot with predicted mortality on the x-axis and observed mortality on the y-axis. A perfect prediction corresponds to the 45°dotted line (ideal calibration line). Calibration curves were bias-corrected using bootstrapping (B=1000 repetitions), indicating the performance of the observed models.
Abbreviations: CCI, Charlson Comorbidity Index; GPI, Geriatric Prognostic Index.