
Figures & data
Figure 1 Flow chart of the formation of the study population.
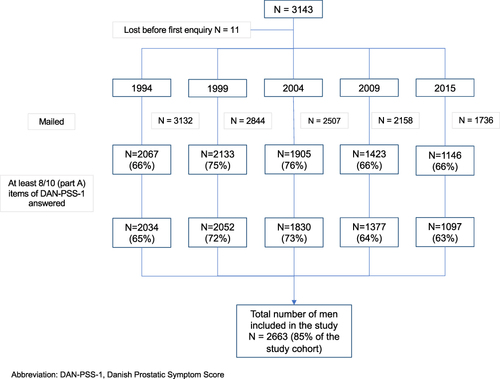
Table 1 AUC, Sensitivity and Specificity of the Random Forest by Using Different Variable Groups
Figure 2 The variation of predicted probability of death between the variable values for age, BMI, DAN-PSS-1 total score and marital status.
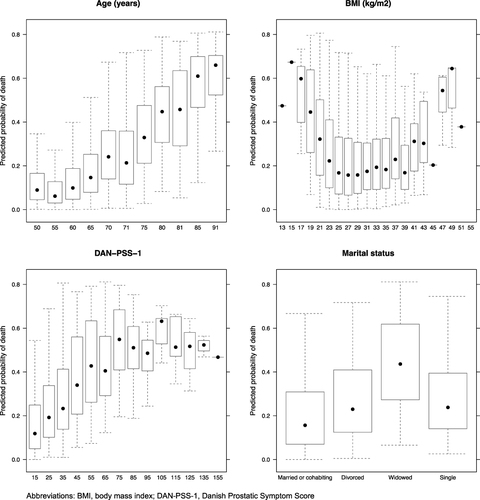
Table 2 AUC of the Random Forest by Using Different Variable Groups to Predict Death Due to Specific Cause