Figures & data
Table 1 Baseline characteristics of the participants who survived during the 12-year follow-up and those who died
Table 2 Mortality due to all-causes, cardiovascular disease, respiratory disease, cancer, or senility for the subscales of the Tokyo Metropolitan Institute of Gerontology (TMIG) index of competence
Figure 1 Overall survival curves during the 12-year follow-up period for the total functional capacity (A), instrumental self-maintenance activity (B), intellectual activity (C), and social roles activity (D).
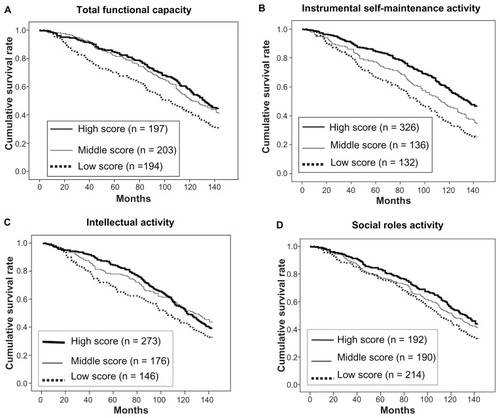
Table 3 Multivariate Cox analyses of the association of gender, smoking, body mass index, serum level of albumin, glucose and total cholesterol with mortality of all-cause, cardiovascular disease, respiratory disease, cancer and senility