Figures & data
Figure 1 Flowchart of study enrollment.
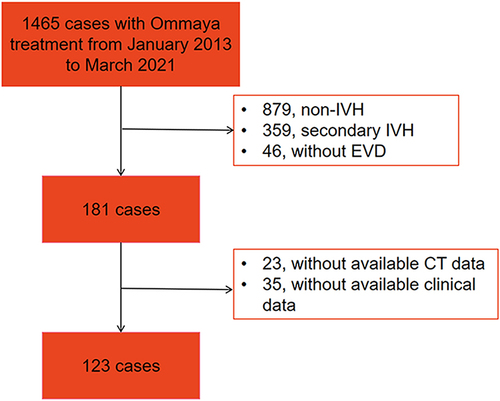
Table 1 Demographic, Clinical, and Neuroradiological Characteristics of Patients
Figure 2 Performance comparison between the groups regarding the different clinical scores recorded at different times during the course with univariate analysis. The patients in the Ommaya-used group showed a lower the GCS before drainage (A), 3-month GOS (B) than those in the Ommaya-unused group. No significance difference was found between the baseline mGS and the mGS 7 days later (C), although there were significant differences in the mGS before drainage (D), 3-day mGS (E) and 7-day mGS (F) postoperatively between the groups. n.s. denotes for no significance; *denotes for “P<0.05”; **denotes for “P<0.01”; ****denotes for “P<0.0001”.
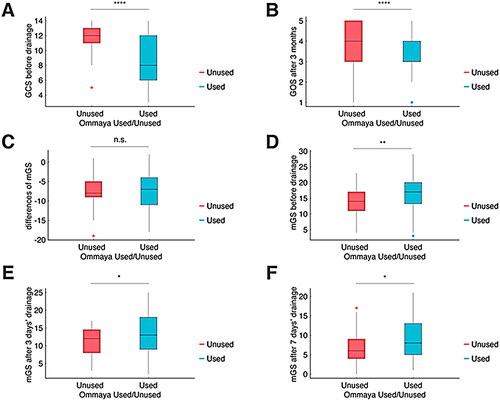
Figure 3 Imaging of IVH patients shown as representative cases. CT scans performed before, 3d and 7d after surgery of Ommaya-used group and Ommaya-unused group. The mGS scores were 20 (before surgery), 16 (3d after surgery) and 5 (7d after surgery) of representative case in Ommaya-used group. The mGS scores were 13 (before surgery), 11 (3d after surgery) and 5 (7d after surgery) of representative case in Ommaya-unused group.
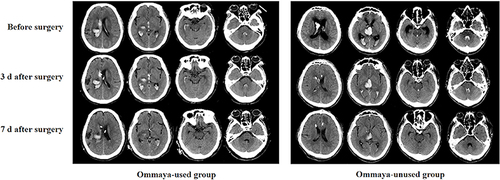
Table 2 Linear Regression Analysis Between Independent Clinical Factors and Clinical Outcomes
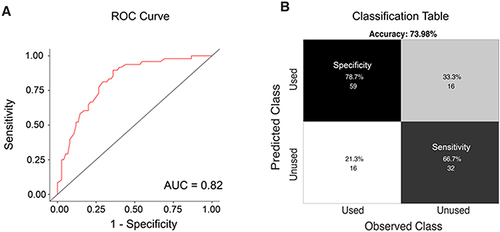
Figure 4 Binomial logistic regression analysis for predicting the probability of using Ommaya. The omnibus likelihood ratio tests showed that the preoperative GCS was the main significant predictor in the model (p<0.001), and the preoperative mGS was marginally significant (p = 0.086). The model showed satisfactory performance in predicting the usage of the Ommaya reservoir. The model achieved an AUC of 0.82 (A), and an accuracy of 0.74, a specificity of 0.79, a sensitivity of 0.67 (B), when the cut-off value was set to 0.5.