Figures & data
Figure 1 Flow chart of the study selection.
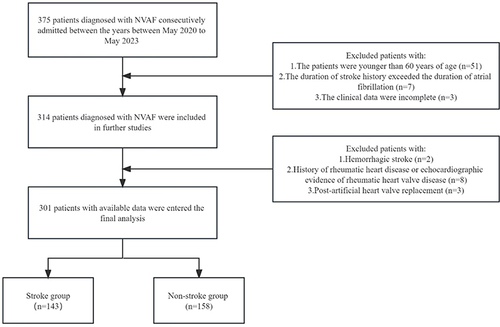
Table 1 Comparison of Baseline Data in the Non-Stroke Group and Stroke Group
Figure 2 (A and B) Predictor plots screened by least absolute shrinkage and selection operator (LASSO) regression analysis.
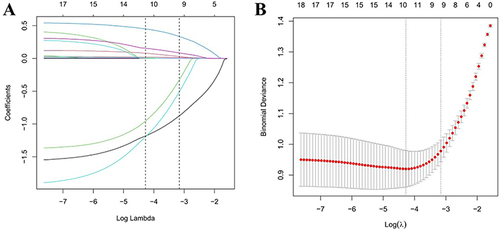
Table 2 Multivariate Logistic Regression Analysis of Influencing Factors for AIS in Elderly Patients with NVAF
Figure 3 Nomogram for predicting the acute ischemic stroke (AIS) in elderly patients with non-valvular atrial fibrillation (NVAF).
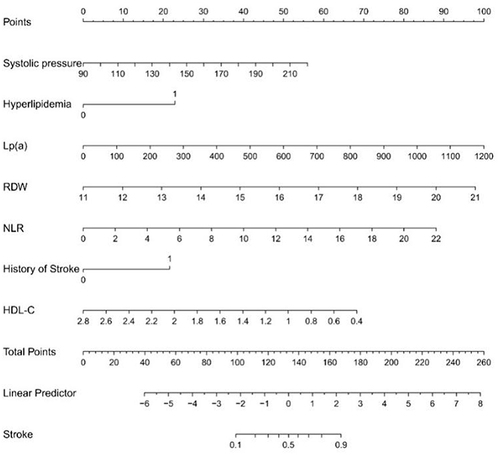
Figure 4 (A) Receiver operating characteristic (ROC) curve of nomogram model in predicting the efficacy of acute ischemic stroke (AIS) in elderly patients with non-valvular atrial fibrillation (NVAF) (training sample). (B) ROC curve of nomogram model in predicting the efficacy of AIS in elderly patients with NVAF (validation sample).
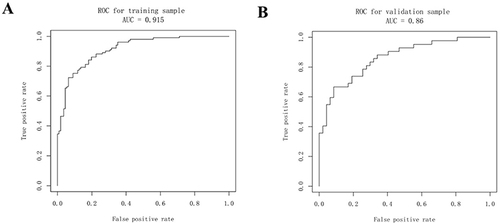
Figure 5 (A) Calibration curve of the training sample. (B) Calibration curve of validation sample. (C) Clinical decision curve analysis (DCA) of training sample for nomogram models. (D) Clinical decision curve analysis (DCA) of validation sample for nomogram models.
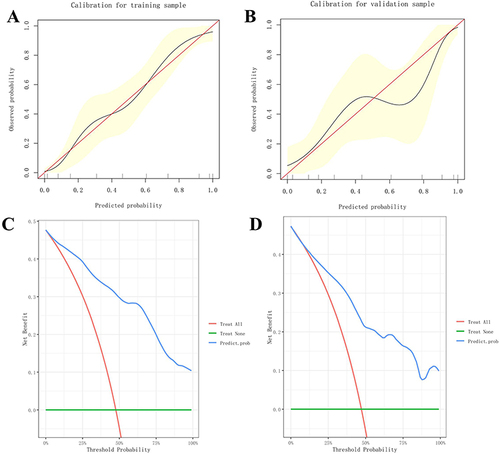
Table 3 Comparison of ROC Curve Between Nomogram Predictive Model and CHA2DS2-VASc Score
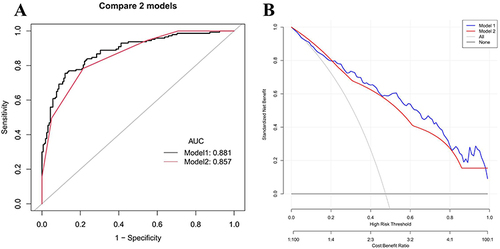
Figure 6 (A) Comparison of ROC curve between nomogram predictive model and CHA2DS2-VASc score. (B) Comparison of clinical decision curve analysis (DCA) between nomogram predictive model and CHA2DS2-VASc score. Model 1: nomogram predictive model. Model 2: CHA2DS2-VASc score.