
Figures & data
Table 1 The Characteristics of Patients
Figure 1 Specific distribution of missing variables. (A) Proportion of missing variables. The missing rate varied from 0.6% to 14.5%; (B) Quantification of missing values across different combinations of variables. Red squares indicate missing data.
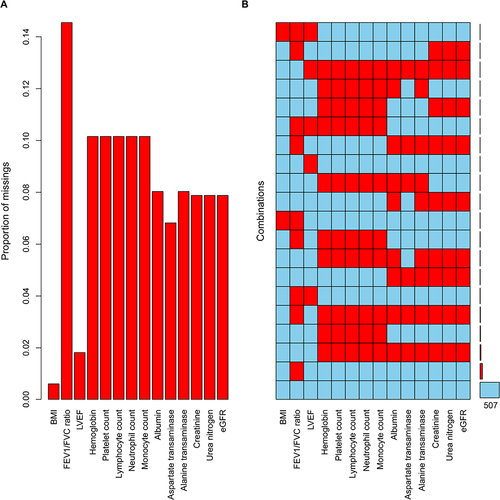
Table 2 Multivariable Logistic Regression for Predictors of PPCs
Figure 2 Distribution of PPCs in the Study. (A) Proportion of various PPCs: The incidences of individual pulmonary complications, ranked from highest to lowest, were pulmonary infection, pleural effusion requiring thoracic drainage, postoperative mechanical ventilation lasting more than 48 hours, ARDS, and re-intubation. (B) Incidence of multiple PPCs in patients. Most patients experienced a single pulmonary complication, with fewer individuals exhibiting various categories of pulmonary complications.
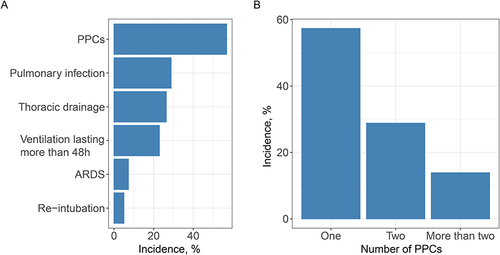
Table 3 Comparison of Short-Term Outcomes in Patients with and without PPCs