Figures & data
Figure 1 Flow chart describing trial progress.
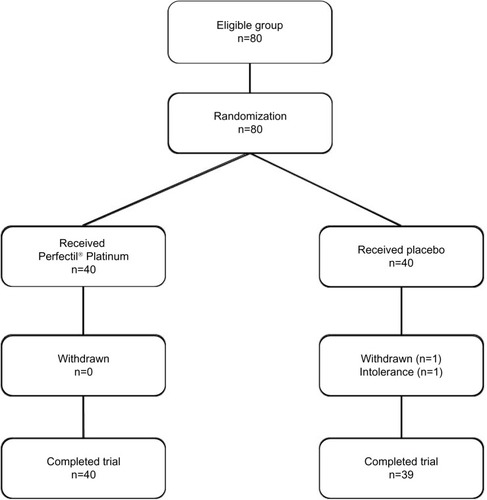
Table 1 Mean minimum and maximum of weather temperature during the study period
Table 2 Nutritional information for Perfectil® Platinum
Figure 2 Patient positioning for standard photography.
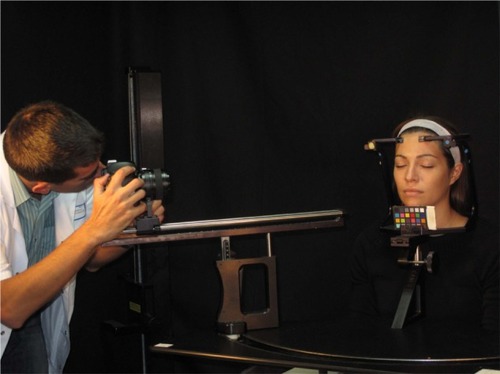
Figure 3 Visioscan® VC 98.
Notes: (A–B) The camera features a high resolution black and white video sensor and a ring shaped UV-A light source (proven to present no hazard to normal human skin) for uniform illumination of the skin. (C) Wrinkles appear dark in the image; scaliness is shown in bright pixels. The software calculates a variety of parameters like roughness indices, skin topography volume, anisotropy and corner density. Visioscan® VC 98; Courage and Khazaka, Cologne, Germany.
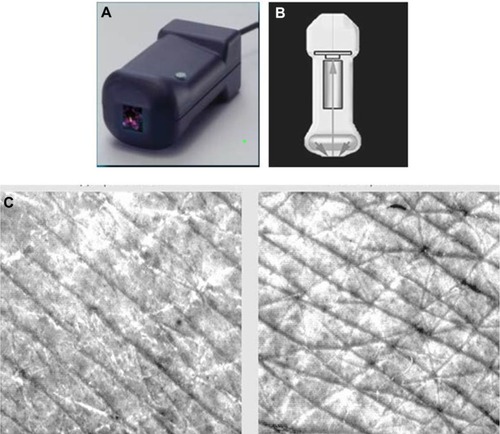
Figure 4 Reviscometer® RVM 600.
Notes: (A) Mechanism: two sensors are applied on the skin surface. One sensor is emitting the acoustic wave A; the other is the receiver B. The software measures the propagation velocity of acoustic shockwaves. (B) Scaled head positioned in 0–180°, 45–225°, 90–270°, and 135–315°-axis, fixed with a double sided adhesive ring. (C) The software calculates the mean value of the RRT (resonance running time) parameter over 4 axes. Reviscometer® RVM 600; Courage and Khazaka, Cologne, Germany.
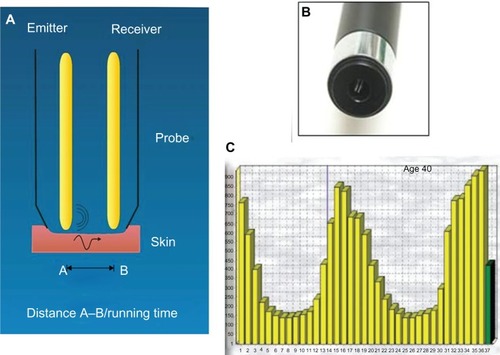
Table 3 Subject demographic data
Table 4 Results of instrumental assessments at T0, T4, and T5.5 in the active and placebo groups including statistical significance
Table 5 Minimum/maximum ratio for nonexposed and exposed study zones at T0, T4, and T5.5 months in active (Perfectil® Platinum) and placebo groups, indicating anisotropia
Figure 5 Skin relief, pseudoroughness Rt (R1) values at T0, T4, and T5.5 months in active treatment and placebo groups.
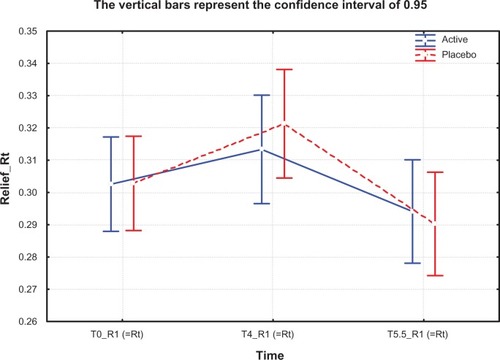
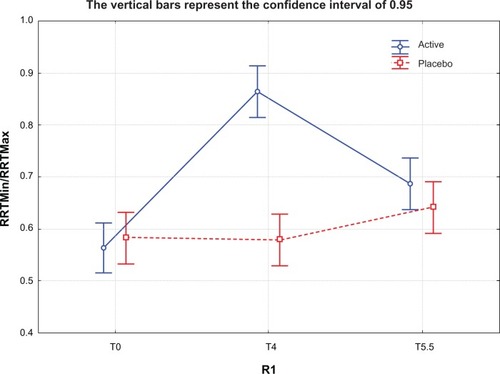
Figure 6 Minimum/maximum resonance running time ratio for nonexposed study zone at T0, T4, and T5.5 months in active treatment (Perfectil® Platinum) and placebo groups. The ratio is increased at T4 for the active group, indicating that anisotropia had decreased by this time (P=0.0579).
Notes: T0, baseline; T4, after 4 months of treatment; T5.5, 6 weeks after termination of treatment. Perfectil® Platinum; Vitabiotics Ltd, London, UK.
Abbreviation: RRT, resonance running time.
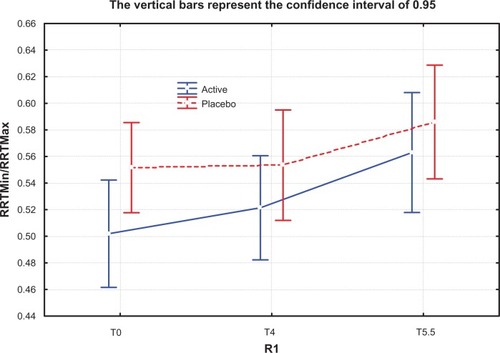
Figure 7 Minimum/maximum resonance running time ratio for exposed study zone at T0, T4, and T5.5 months in active treatment (Perfectil® Platinum) and placebo groups. The ratio is increased at T4 for the active group, indicating that anisotropia had decreased by this time (P=0.0579).
Abbreviation: RRT, resonance running time.