Figures & data
Table 1 Characteristics of Participants in the Development and Validation Groups
Table 2 Pearson’s Correlation Coefficients of Anthropometric and Physical Function Parameters with BIA-Measured ASM
Table 3 BIA-Measured ASM Estimating Equations Deduced from Age, Anthropometric and Physical Function Parameters (n = 1076)
Table 4 Comparison of the Estimated ASMs with BIA-Measured ASM (n = 461)
Figure 1 Correlation between Estimated ASMs by the Equations and BIA-measured ASM in the Validation Group. (A) Correlation between ASM4 and BIA-measured ASM. (B) Correlation between ASM5 and BIA-measured ASM. (C) Correlation between ASM8 and BIA-measured ASM. (D) Correlation between ASM9 and BIA-measured ASM.
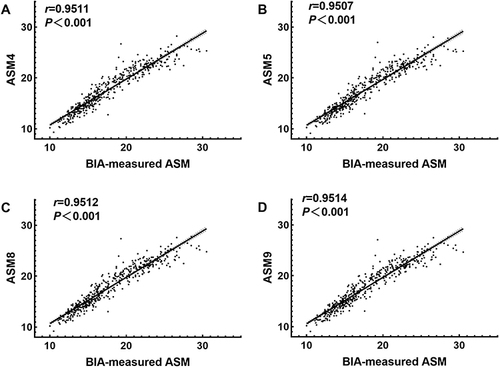
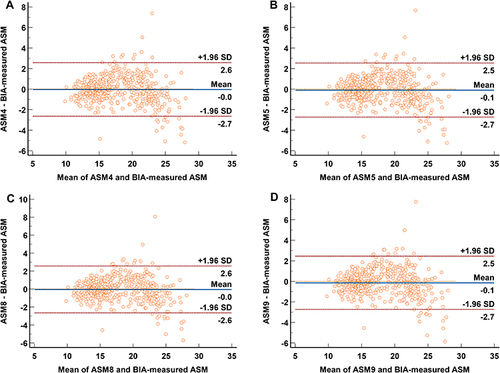
Table 5 The Bland-Altman Plot of the Estimated ASMs with Different Equations (n=461)
Figure 2 Bland-Altman plots of estimated ASMs and BIA-measured ASM in the validation group. (A) Bland-Altman plots of ASM4 and BIA-measured ASM. (B) Bland-Altman plots of ASM5 and BIA-measured ASM. (C) Bland-Altman plots of ASM8 and BIA-measured ASM. (D) Bland-Altman plots of ASM9 and BIA-measured ASM.