
Figures & data
Figure 1 Volcano maps (left) and heat maps (right) of DEmRNAs. (A and B): Volcano map (left) and heat map (right) of DEmRNAs in the OWF vs HC group; (C and D): Volcano map (left) and heat map (right) of DEmRNAs in the OVF vs HC group; (E and F), Volcano map (left) and heat map (right) of DEmRNAs in the OVF vs OWF group. HC, OWF and OVF represent the healthy control, osteoporosis patients without vertebral fracture and osteoporosis patients combined with vertebral fracture, respectively.
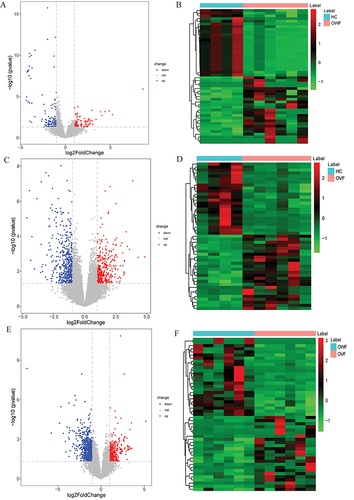
Figure 2 The volcano map (left) and heat map (right) of DElncRNAs. (A and B): Volcano map (left) and heat map (right) of DElncRNAs in the OWF vs HC group; (C and D): Volcano map (left) and heat map (right) of DElncRNAs in the OVF vs HC group; (E and F): Volcano map (left) and heat map (right) of DElncRNAs in the OVF vs OWF group. HC, OWF and OVF represent the healthy control, osteoporosis patients without vertebral fracture and osteoporosis patients combined with vertebral fracture, respectively.
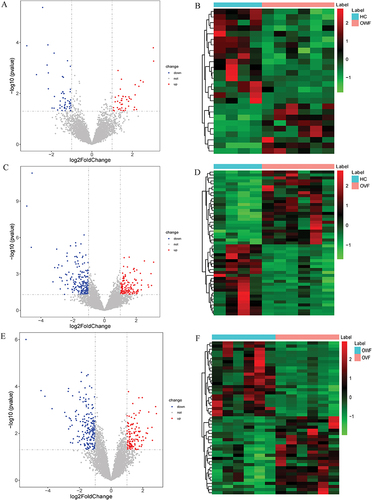
Figure 3 The Venn diagram of DEmRNAs and DElncRNAs in OWF vs HC, OVF vs HC and OVF vs OWF groups. (A): Venn diagram of DEmRNAs; (B), Venn diagram of DElncRNAs. HC, OWF and OVF represent the healthy control, osteoporosis patients without vertebral fracture and osteoporosis patients combined with vertebral fracture, respectively.
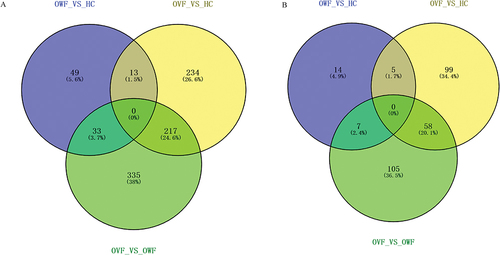
Figure 4 The co-expression network diagram of obtained mRNA and lncRNA. Circle, V-shape, red and blue represents DEmRNA, DElncRNA, up-regulation and down-regulation, respectively.
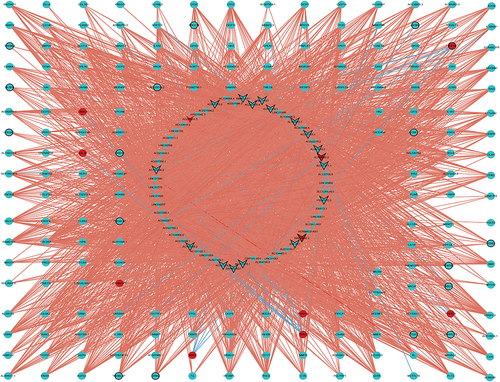
Figure 5 Bubble plot of GO and KEGG pathway analysis of co-expressed DEmRNAs with DElncRNAs. (A): Top 15 significantly enriched biological processes (BP); (B): Top 15 significantly enriched cell component (CC); (C): Top 15 significantly enriched molecular function (MF); (D): Top 15 significantly enriched KEGG pathway.
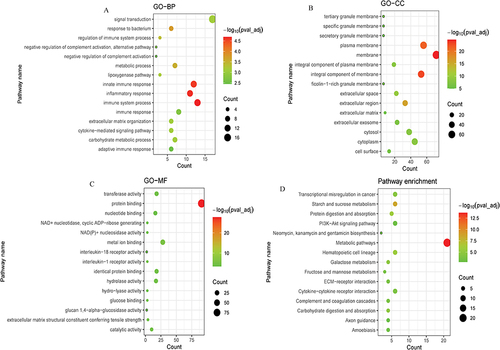
Figure 6 Immune-related co-expressed fracture-related lncRNAs and mRNAs. (A): Venn diagram of 33 immune-related DEmRNAs; (B): The co-expression network of 25 immune-related DEmRNAs; (C): the PPI network of 33 immune-related DEmRNAs; (D): 8 core mRNAs (IL18R1, IL18RAP, SLC11A1, CSF2RA, CCR3, IL1R2, PGLYRP1, and IL1R1) screened by 4 algorithms.
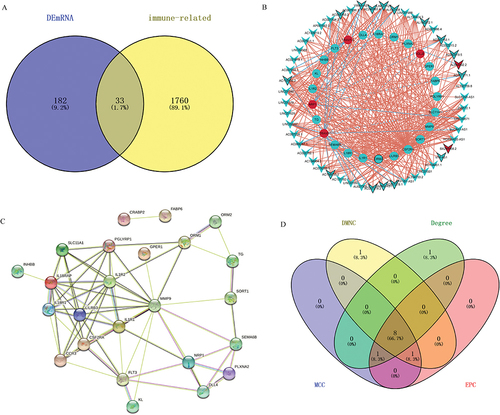
Figure 7 The lncRNA-miRNA-mRNA network and TFs network associated with hub DEmRNAs. (A): The lncRNA-miRNA-mRNA network network associated with hub DEmRNAs. Circles, squares and V-shapes represent DEmRNA, miRNA and DElncRNA, respectively. (B): The TFs network associated with hub DEmRNAs. Circles and squares represent DEmRNA and TFs, respectively.
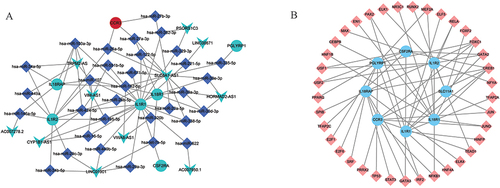
Figure 8 The hub mRNA-lncRNA co-expression sub-network. Seven genes (IL18R1, IL18RAP, SLC11A1, CSF2RA, IL1R2, PGLYRP1, and IL1R1) were included. Circle, V-shape, red and blue represents DEmRNA, DElncRNA, up-regulation and down-regulation, respectively.
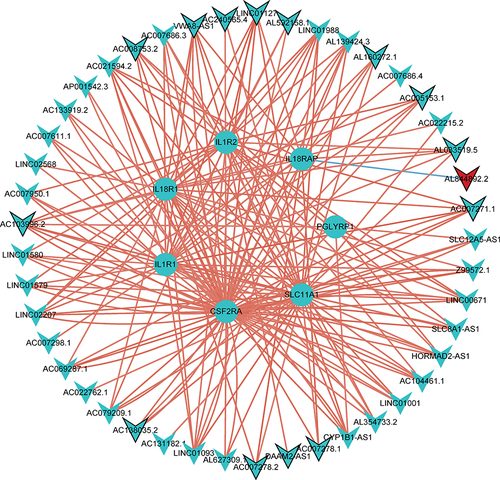
Table 1 All Primer Sequences Used for Real-Time PCR Validation
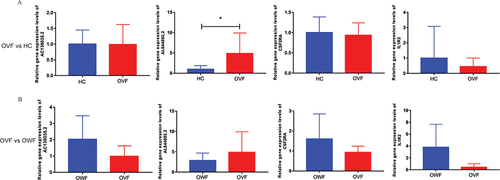
Figure 9 Expression validation of AC138035.2, AL844892.2, CSF2RA and IL1R2 by real-time PCR. (A): Relative expression levels of AC138035.2, AL844892.2, CSF2RA and IL1R2 in OVF vs HC group; (B): Relative expression levels of AC138035.2, AL844892.2, CSF2RA and IL1R2 in OVF vs OWF group. *P <0.05. HC, OWF and OVF represent the healthy control, osteoporosis patients without vertebral fracture and osteoporosis patients combined with vertebral fracture, respectively.
Data Sharing Statement
The datasets generated during and/or analysed during the current study are available from the corresponding author on reasonable request.