
Figures & data
Figure 1 Flow chart of included patients.
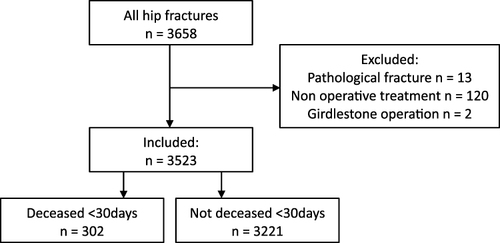
Figure 2 Kaplan–Meier curve of the 30-day mortality rates after Hip fracture surgery. Blue line: survivors’ function, with 95% CI.
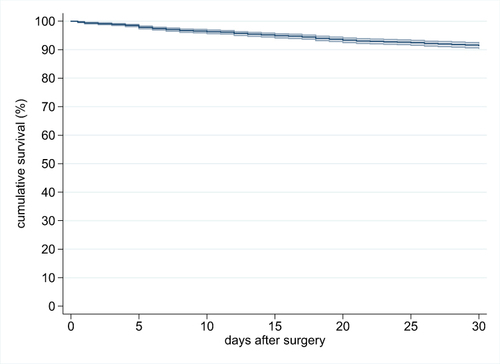
Table 1 Univariable Analyses of Risk and Prognostic Baseline Factors
Table 2 Univariable Analysis of Risk Factors, Prognostic Perioperative Factors
Table 3 Multivariable Analysis of Factors Associated with 30-Day Mortality After Backward Selection