Figures & data
Table 1 Baseline characteristics of the study participants (mean ± standard deviation)
Figure 1 Recruitment and allocation of the study participants.
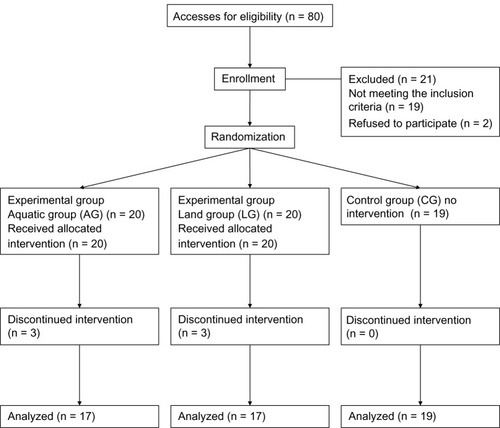
Table 2 Progression of the 6-month aquatic- and land-based programs
Table 3 Effect of the exercise program on physical performance, upper- and lower-body strength (mean ± standard deviation)
Table 4 Effect of the exercise program on body composition (mean ± standard deviation)
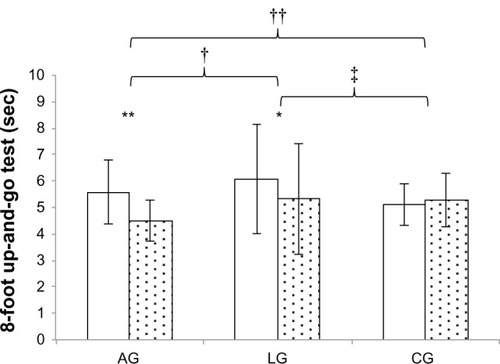
Figure 2 Dynamic balance at baseline (white columns) and after six months (dotted columns).
Notes: *Indicates a statistically significant difference (P < 0.05); **indicates P value < 0.01; †indicates a between-group statistically significant difference (P < 0.01) while ‡indicates between-group significance with P value < 0.05; ††intra groups indicates statistically significant difference (ANOVA).
Abbreviations: AG, aquatic group; LG, land group; CG, control group.
Abbreviations: AG, aquatic group; LG, land group; CG, control group.