Figures & data
Figure 1 Flow chart of patient selection.
Abbreviations: SOE, stroke of other determined etiology; SUE, stroke of undetermined etiology; LAA, large artery atherosclerosis; CE, cardioembolism.
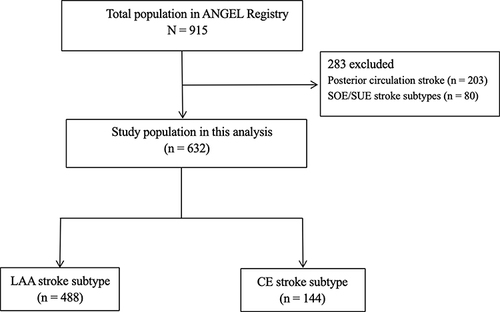
Table 1 Baseline Characteristics and Outcome of Between LAA and CE
Table 2 Adjusted or/HR of Safety and Efficacy Outcome According to Different Pathogenic Subtypes
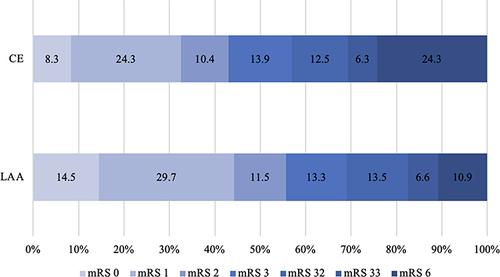
Figure 2 Shift on 90-day mRS score stratified by LAA and CE.
Abbreviations: mRS, modified Rankin Scale; LAA, large artery atherosclerosis; CE, cardioembolism.