Figures & data
Figure 1 Participant flow diagram depicting screening/enrollment process.
Note: *Events at first hospitalization.
Abbreviations: CKD, chronic kidney disease; AF, atrial fibrillation; CHADS2 score, congestive heart failure (1 point), hypertension (1 point), ≥75 years old (1 point), diabetes (1 point), prior stroke or transient ischemic attack or thromboembolism (2 points); eGFR, estimated glomerular filtration rate; INR, international normalized ratio.
Abbreviations: CKD, chronic kidney disease; AF, atrial fibrillation; CHADS2 score, congestive heart failure (1 point), hypertension (1 point), ≥75 years old (1 point), diabetes (1 point), prior stroke or transient ischemic attack or thromboembolism (2 points); eGFR, estimated glomerular filtration rate; INR, international normalized ratio.
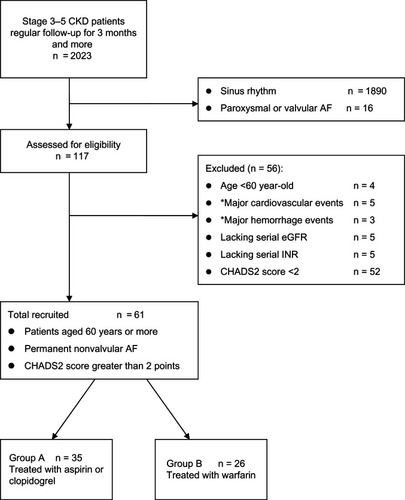
Table 1 Categorical comparison of data in enrolled age, baseline renal function, and biochemistry between group A and group B
Table 2 Results of linear regression model using generalized estimating equation method for glomerular filtration rate
Figure 2 Change in estimated GFR between the two groups was measured over time (at months 3, 6, 12, and 18) after introduction of warfarin.
Abbreviations: GFR, glomerular filtration rate; eGFR, estimated glomerular filtration rate.
Notes: The Wilcoxon signed rank test was used to examine within-group improvement at different time points, showing an increase in the medians over time in group B. There was no significant difference in change in eGFR between the groups at any time point, but there was a trend towards improvement in renal function in group B.
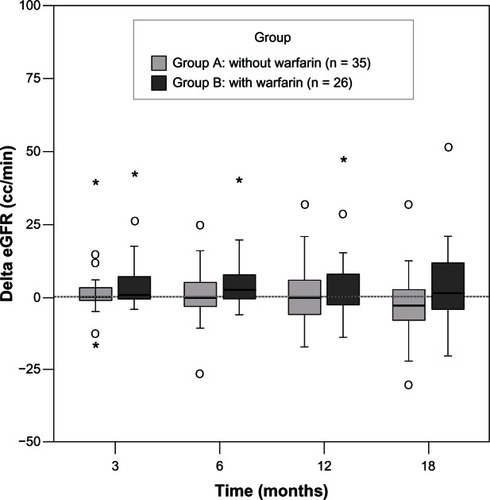
Table 3 Multivariate Cox proportional hazards regression analysis of mortality
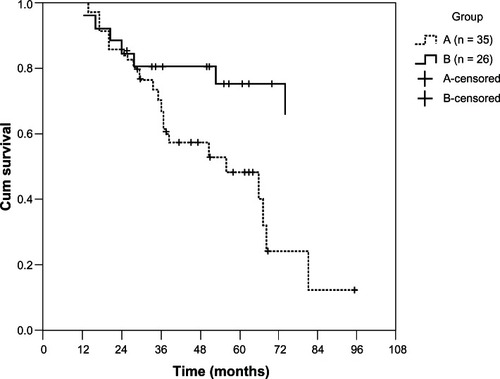
Figure 3 The survival curves for both groups were evaluated using the Kaplan–Meier method and the log rank test.
Notes: During the 12-year observational period, patients on warfarin had better survival than those not on warfarin (P = 0.013).