Figures & data
Table 1 Patient demographics
Table 2 Qmax and PVR of the 2 groups before and 12 weeks after operation
Figure 1 IPSS scores of the two groups before and 12 weeks after the surgery.
Notes: *Mann–Whitney U test.
Abbreviation: IPSS, International Prostate Symptom Score.
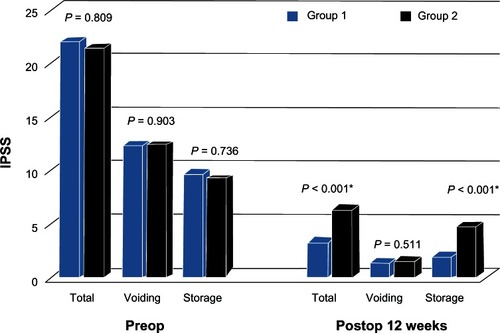
Figure 2 The IPSS changes over time, in the two groups.
Abbreviation: IPSS, International Prostate Symptom Score.
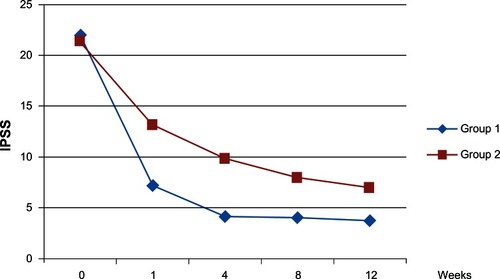
Table 3 SF-36 scores before the operation
Table 4 SF-36 scores of the two groups 12 weeks after operation