Figures & data
Table 1 Baseline characteristics of the participants
Figure 1 Participant disposition in 16-week study.
Note: Randomization and follow-up study.
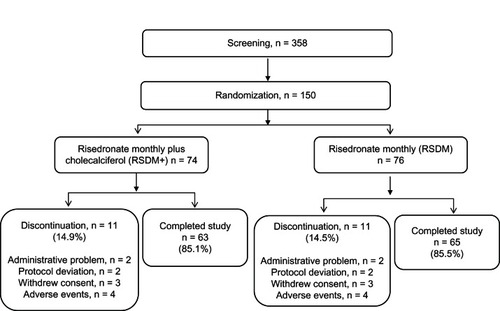
Figure 2 Mean changes in serum 25-hydroxyvitamin D (25[OH]D) concentration after 16 weeks of treatment.
Abbreviations: RSDM+, monthly risedronate and cholecalciferol; RSDM, monthly risedronate alone.
![Figure 2 Mean changes in serum 25-hydroxyvitamin D (25[OH]D) concentration after 16 weeks of treatment.Abbreviations: RSDM+, monthly risedronate and cholecalciferol; RSDM, monthly risedronate alone.](/cms/asset/e81d2497-a632-4c06-94f6-229f6016f99f/dcia_a_44395_f0002_b.jpg)
Figure 3 Percentages of participants with 25-hydroxyvitamin D level in different subcategories at week 16.
Abbreviations: RSDM+, monthly risedronate and cholecalciferol; RSDM, monthly risedronate alone.
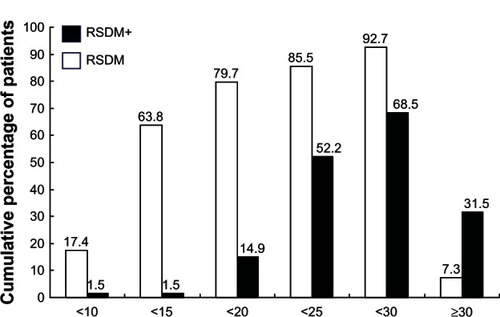
Figure 4 Mean changes in 25-hydroxyvitamin D (25[OH]D) level in each group with different baseline subcategories.
Abbreviations: RSDM+, monthly risedronate and cholecalciferol; RSDM, monthly risedronate alone.
![Figure 4 Mean changes in 25-hydroxyvitamin D (25[OH]D) level in each group with different baseline subcategories.](/cms/asset/caff1824-4324-4f9d-9e68-219926ab3939/dcia_a_44395_f0004_b.jpg)
Table 2 Changes in PTH, calcium, phosphorus, and bone turnover markers between baseline and week 16 of treatment