Figures & data
Figure 1 Decline in resting cardiac output as a function of age in men (black) and women (red). Measurements obtained 5–10 minutes after subjects assumed a semi-reclined position using an earpiece dye-dilution method. In this cohort study, cardiac output peaks near age 20, then declines continuously with increasing age at an approximate rate of 50mL per year. (After Katori, 1978).Citation20
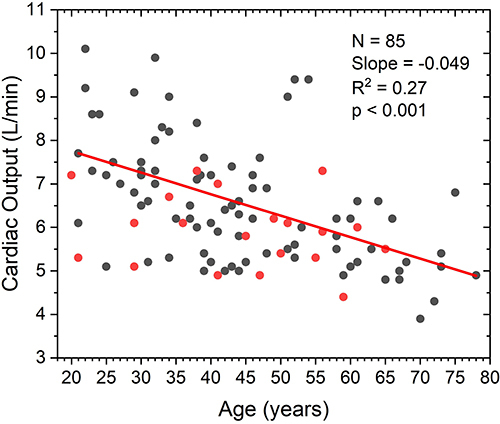
Figure 2 Distribution of soleus muscle fatigue resistance in older (age 61–81 years) non-athletic men and women. Fatigue resistance was assessed through slow (60°/second) one-legged heel raises (IRB exempt pilot study). While normative data indicates that healthy adults in this age range should be able to complete about 16 such heel raises before fatiguing, only 2 of 29 individuals in this convenience sample achieved this level of soleus fatigue resistance.
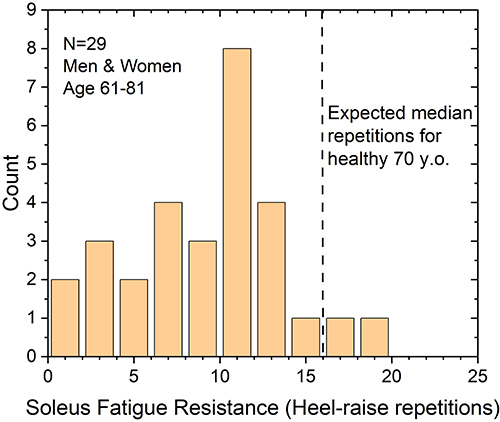
Figure 3 Resting diastolic blood pressure (DBP) as a function of soleus fatigue resistance. In a group of non-athletic (those undertaking less than 3 hours per week of intense physical activity) older adult (61–81 years) men and women, DBP was obtained following 10 minutes of quiet sitting (IRB exempt pilot study). Soleus fatigue resistance obtained by one-legged heel raises. DBP is significantly correlated to soleus fatigue strength (p=0.0001). Two-thirds of subjects were found to be unable to maintain a normal level of DBP (>80mmHg).
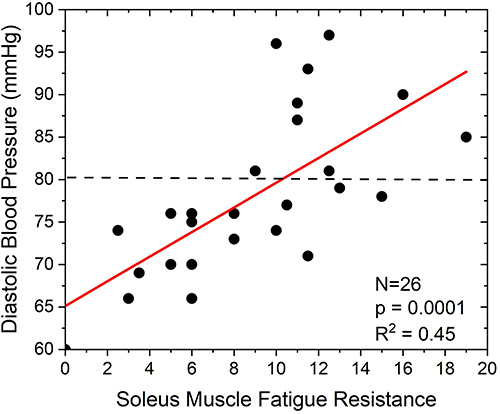
Figure 4 Cardiac Index tracked over two hours during quiet sitting. Cardiac index (CI) in 21 women aged 45–65 years was obtained using continuous cardiac output monitoring (NICOM, Cheetah, Inc.) as they transitioned from quiet standing to quiet sitting. Within 10 minutes, CI falls from 3.3 L/min/m2 to 2.8 L/min/m2, or about 15%, consistent with the difference in metabolic rate required for quiet standing vs quiet sitting. CI is then observed to continue to decline for two hours, reaching 2.2 L/min/m2, a level capable of supporting only about 1.0 METs of metabolic activity. Data obtained in IRB approved study undertaken at Binghamton University, Binghamton, NY.
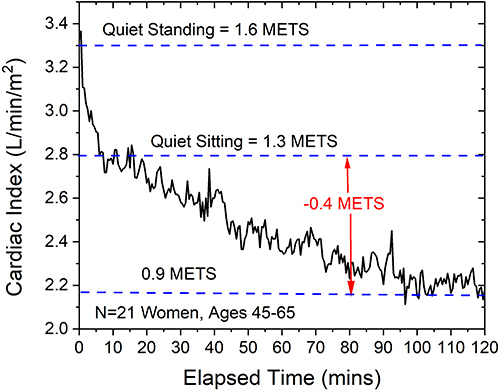
Figure 5 Stroke volume index (SVI) in five older adults (aged 57–68 years) following transition from a quiet standing to a quiet seated position, with (red) and without (black) soleus muscle stimulation. In the absence of muscle stimulation, SVI rapidly falls from 38 mL/m2 to 28 mL/m2, consistent with the reduced metabolic requirement of quiet sitting versus quiet standing. SVI then continues to fall for up to an hour, reaching an SVI of 23 mL/m2. Repeated with concurrent soleus muscle stimulation, SVI again demonstrates a rapid decline over the first 5–10 minutes, but then SVI slowly increases over the following 50 minutes. At the one-hour time point, SVI has risen to 29 mL/m2, a level sufficient to support an estimated 1.4 METs of metabolic activity. (Data from IRB approved clinical study executed at Binghamton University, Binghamton, NY).
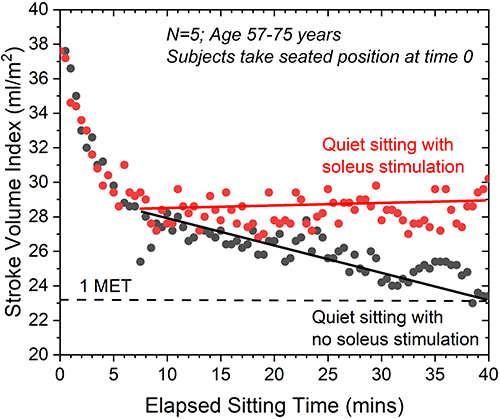
Figure 6 Change in bone mineral density (BMD) over one year in a peri-menopause study population (age 42–68) undergoing daily soleus muscle stimulation. Change in BMD obtained by dual energy x-ray densitometry for the lumbar spine, proximal femur and proximal tibia. BMD change at the three sites are averaged. Change in BMD is significantly correlated to duration of daily soleus muscle stimulation. Less than 1 hour/day usage is associated with an average 1.5% decline in BMD. Average daily usage of over 4 hours/day is associated with a 1.5% increase in BMD. Daily use of soleus stimulation for 2.5 hours/day, or less than 1/3 of typical daily sedentary activity time appears to be sufficient to prevent net bone loss in this population. (After McLeod and Pierce, 2018).
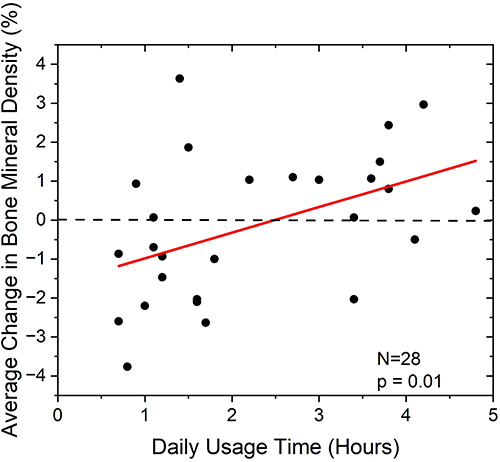
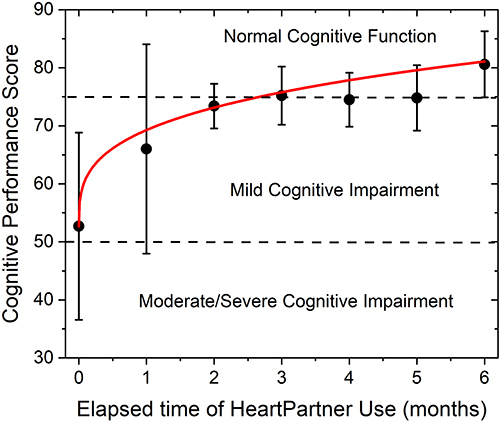
Figure 7 Change in cognitive performance in an older adult (aged 71–81 years) population identified by their primary care physician as demonstrating cognitive challenges. Cognitive performance measured using the Cognivue, Inc. (Victor, NY) computer aided cognitive assessment tool. Average initial assessment for this group place their performance near the border of significant cognitive impairment. Daily soleus stimulation use resulted in significant improvement in cognitive performance, with performance attaining a level associated with normal cognitive function after 3 months. Continued daily soleus muscle stimulation resulted in a continued slow improvement in cognitive performance. (Data from IRB approved pilot study).