Figures & data
Table 1 Characteristics of 259 patients with small-cell carcinoma of the prostate diagnosed between January 1973 and December 2004
Figure 1 (A) Kaplan–Meier curve for overall survival (OS) in the entire cohort of patients with small-cell carcinoma of the prostate (SCCP) (n = 259). (B) cancer-specific survival of patients with SCCP. (C) cancer-specific survival of patients with SCCP by tumor histological grade. (D) cancer-specific survival of patients with SCCP by tumor stage. (E) cancer-specific survival of patients with SCCP by age group.
Notes: For the cancer-specific survival analyses, we excluded cases identified at autopsy or on the basis of death certificates only, and those with multiple primaries. A total of 218 patients were included in the cancer-specific survival analysis. The P value is shown for the log-rank test between variables.
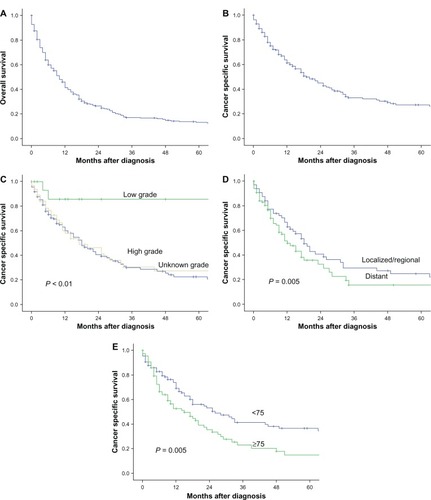
Table 2 Cox proportional multivariate analysis of factors associated with cancer-specific mortality in 218 patients with small-cell carcinoma of the prostate