Figures & data
Table 1 Baseline characteristics in the treatment groups
Figure 1 Patient flowchart.
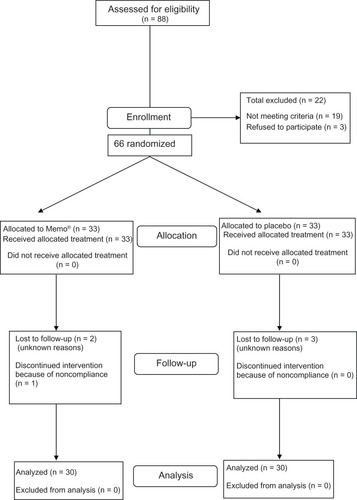
Table 2 Paired statistics for mean MMSE scores before treatment and after 4 weeks
Table 3 Comparison of the mean difference in MMSE scores between treatment groups
Table 4 General linear model analysis of covariance (ANCOVA) for the treatment effect corrected for age and education level within treatment groups
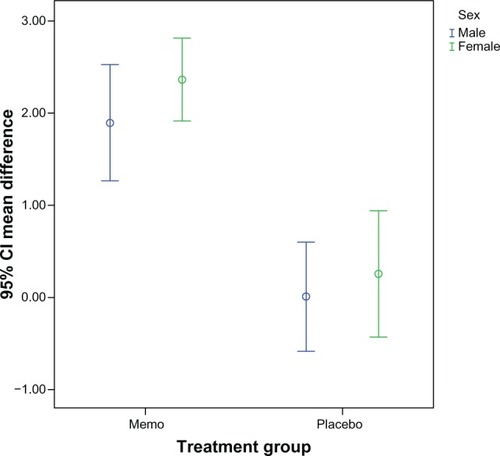
Figure 2 Significantly superior effect of 4 weeks of treatment with Memo® on the MMSE score in men and women. There was no significant effect of gender on the outcome measure.
Abbreviations: CI, confidence interval; MMSE, Mini-Mental State Examination.