Figures & data
Table 1 Patients’ Characteristics Including Demographic Items (n=19)
Table 2 Patients’ Characteristics Including Clinical Items (n=19)
Figure 1 Example of a treatment session using radial ESWT for a VLU (A) and DFU (B).
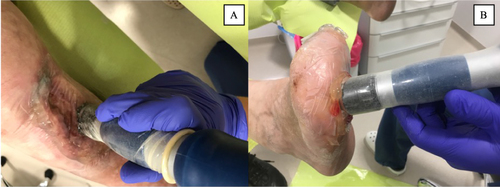
Table 3 Planimetric Results Prior-ESWT and Post-ESWT for All Wounds (n=31) and PUs Alone (n=22)
Figure 2 Example of planimetric effects of radial ESWT for a patient with a PU (A), VLU (B), and DFU (C).
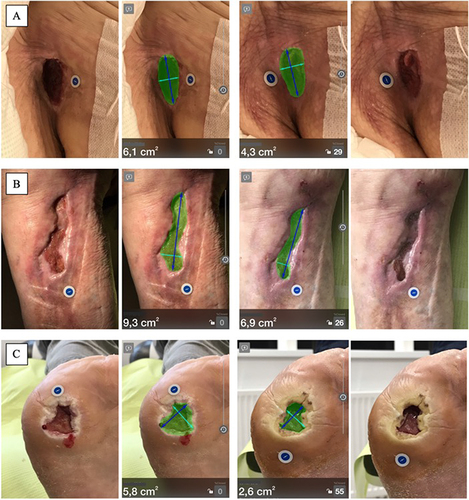
Table 4 Clinical Results Using the WBS and BWAT Results Prior-ESWT and Post-ESWT for All Wounds (n = 31) and PUs Alone (n=22)
Table 5 Correlations Between Clinical Wound Assessment Using the WBS and BWAT and Their Metric Parameters Following the Planimetric Assessment
Figure 3 Correlation diagrams for clinical wound assessment using the WBS and BWAT with the wound area before and after ESWT (A and B) and separately after ESWT only (C and D).
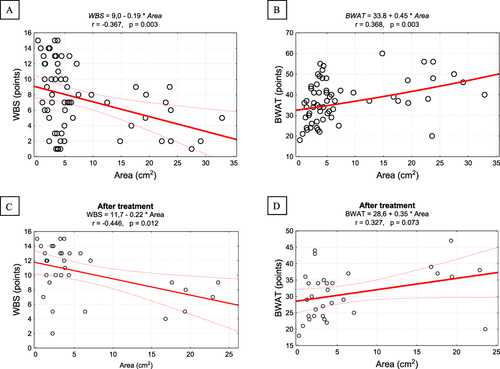
Figure 4 Correlation diagram for clinical wound assessment using the WBS and BWAT overall (A) and separately before and after ESWT (B and C).
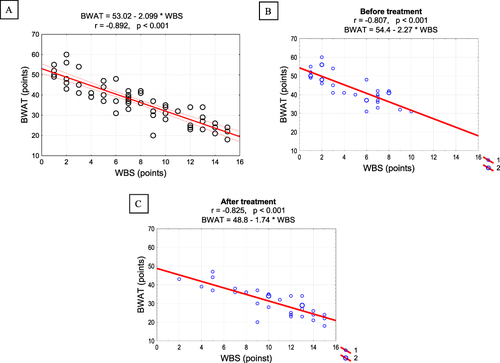
Figure 5 Summary of therapeutic effect for clinical wound assessment using the WBS (A) and BWAT (B) in terms of the groups of wounds of different etiology.
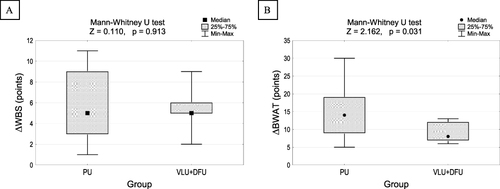
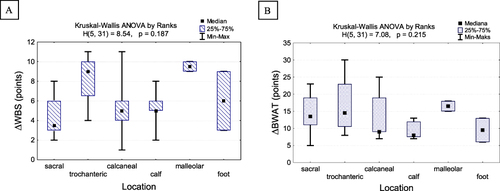
Figure 6 Summary of therapeutic effect for clinical wound assessment using the WBS (A) and BWAT (B) in terms of the groups of wounds with different anatomical locations.