Figures & data
Table 1 Survey-Weighted Characteristics of the NHANES Sample According to CDAI Tertiles
Figure 1 Participants are selected according to the flowchart.
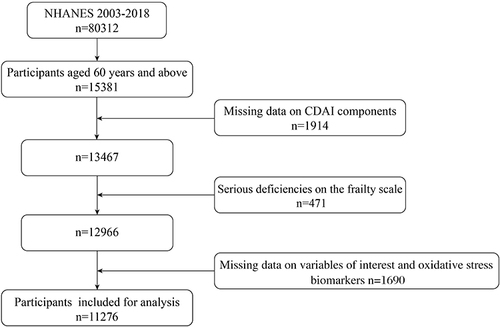
Table 2 Multiple Logistic Regression Analysis on the Association Between CDAI and the Risk of Frailty
Figure 2 Subgroup analysis of risk factors for the relationship between CDAI and frailty. Each stratification was adjusted for age, sex, race/ethnicity, smoking status, educational level, family income to poverty ratio and physical activity, except the stratification factor itself.
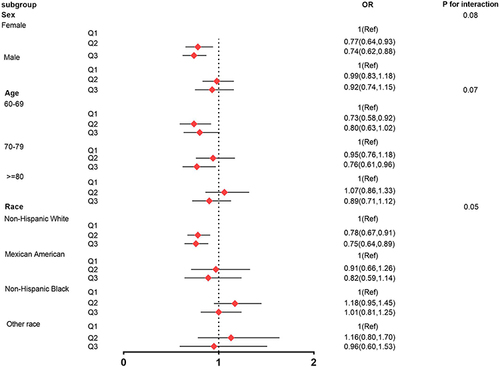
Figure 3 Restricted cubic spline plot of the association between CDAI and the risk of frailty. Model was adjusted for age, sex, race/ethnicity, smoking status, educational level, family income to poverty ratio and physical activity.
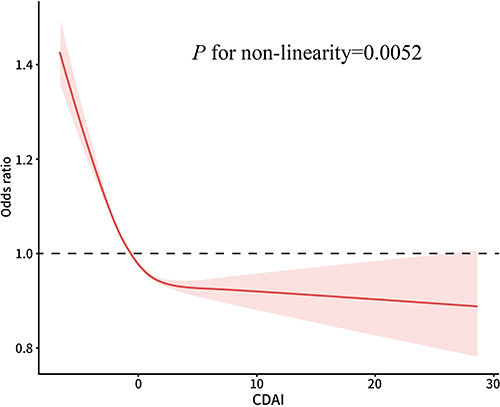
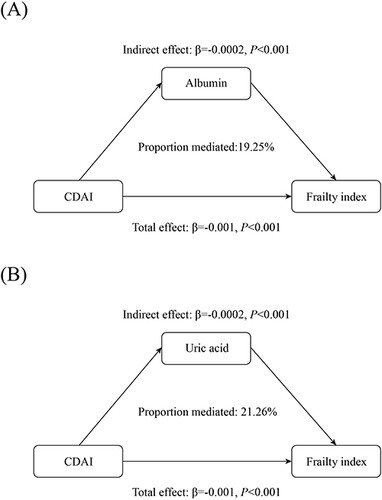
Figure 4 Estimated proportion of the association between CDAI and frailty index mediated by oxidative stress markers. (A) The association between CDAI and frailty index mediated by albumin. (B) The association between CDAI and frailty index mediated by uric acid.