
Figures & data
Table 1 Baseline Characteristics of Mechanical Thrombectomy Treated Acute Ischemic Stroke Patients
Figure 1 Functional outcomes at 90 days among all patients.
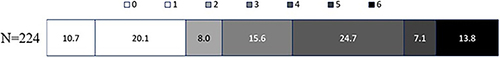
Figure 2 Trajectory groups of HR repeatedly measured during the first 72 hours after MT. Group 1 (red), a low HR group (n=43, 19.2%); Group 2 (yellow), a moderate HR group (n=74, 33.0%); Group 3 (blue), a rapidly stabilized HR group (n=46, 20.5%); Group 4 (green), a persistently high HR group (n=47, 21.0%); Group 5 (black), a very high HR group (14, 6.3%).
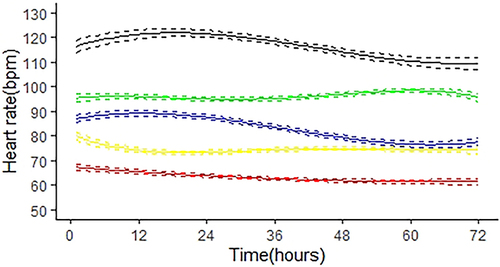
Table 2 The Association Between Groups and 3-Month Poor Functional Outcome (mRS >2) in MT-Treated Acute Ischemic Stroke Patients
Table 3 The Association Between Groups and 3-Month All-Caused Mortality (mRS = 6) in MT-Treated Acute Ischemic Stroke Patients