
Figures & data
Table 1 Primer Sequences of RT-qPCR
Table 2 Clinical Baseline Characteristics of the Control Group and AF Group
Figure 1 Expression levels of miR-29b-3p in the serum of AF patients. The serum expression of miR-29b-3p was determined by RT-qPCR. The t-test was used for data comparisons between two groups. ***P < 0.001.
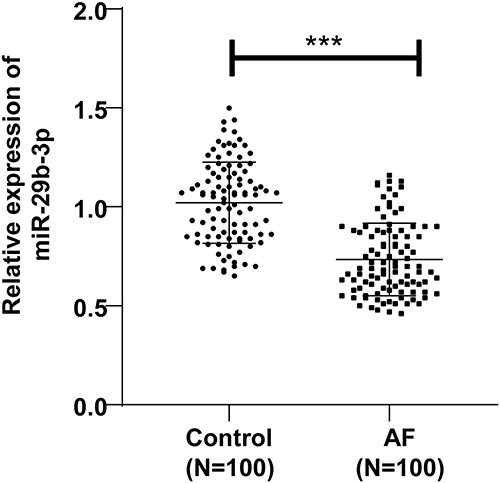
Figure 2 Differential expression of serum miR-29b-3p in AF patients before and after RFCA. The expression levels of serum miR-29b-3p in AF patients before and after RFCA were measured by RT-qPCR. Data comparisons between groups were analyzed by the t-test. *P < 0.05.
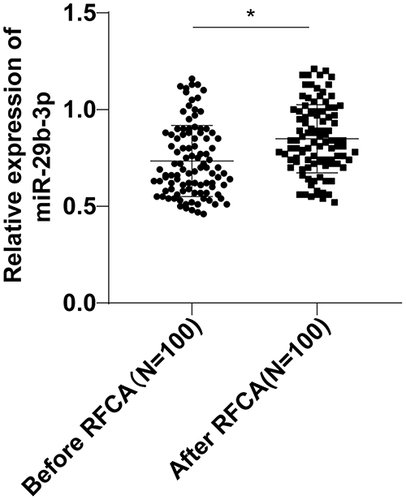
Figure 3 Correlation analysis between miR-29b-3p and markers of atrial fibrosis. The Pearson method was used to analyze the correlation between the expression level of miR-29b-3p and serum (A) FGF-21 and (B) FGF-23 levels in the AF group. (A and B) were analyzed by Pearson’s coefficient.
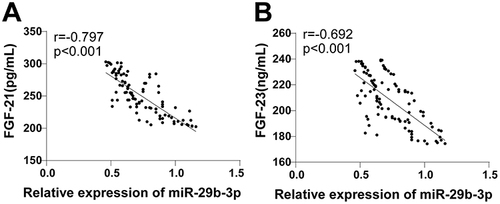
Table 3 Comparison of Preoperative General Clinical Data Between Non-Recurrent and Recurrent AF Groups
Figure 4 Low expression of serum miR-29b-3p predicted a high risk of recurrence of AF after RFCA. (A) RT-qPCR was used to determine the differential expression of serum miR-29b-3p between the AF non-recurrent and recurrent groups; (B–E) The ROC curves of serum miR-29b-3p, FGF-21, and FGF-23 levels for the identification of AF recurrence after RFCA; (E) Kaplan-Meier curve analysis. (A) was analyzed using the t-test. ***P < 0.001.
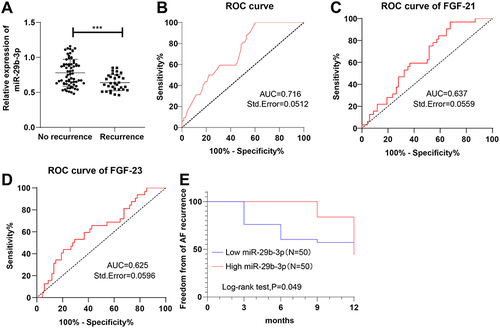
Table 4 Comparison of Postoperative Recurrence of AF in Patients with Different miR-29b Levels
Table 5 Logistic Regression Analysis of Factors Influencing Postoperative AF Recurrence