Figures & data
Figure 1 In vitro antiproliferative effect of the combination treatment of gemcitabine and sirtinol in PANC-1, BxPC-3, and SW1990 cells.
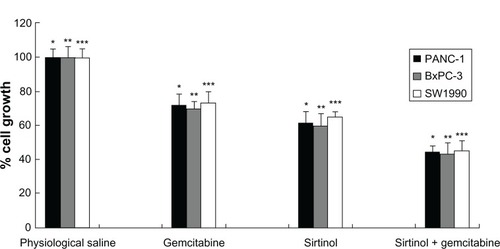
Figure 2 In vitro apoptosis effect of combination treatments of gemcitabine and sirtinol in PANC-1, BxPC-3, and SW1990 cells.
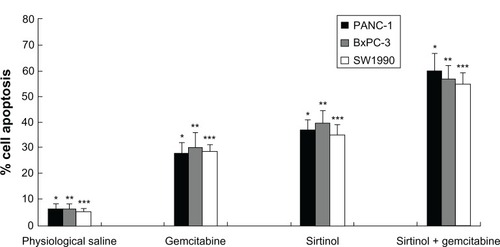
Figure 3 In vitro cleaved PARP-1 effect of drug in PANC-1 cells.
Note: *P < 0.05 against physiological saline control.
Abbreviations: GAPDH, glyceraldehyde 3-phosphate dehydrogenase; PARP, poly ADP ribose polymerase.
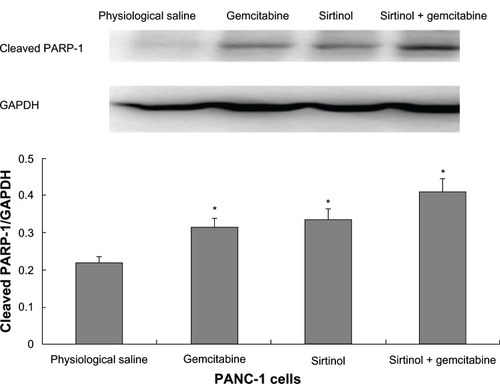
Figure 4 In vitro cleaved PARP-1 effect of drug in BxPC-3 cells.
Abbreviations: GAPDH, glyceraldehyde 3-phosphate dehydrogenase; PARP, poly ADP ribose polymerase.
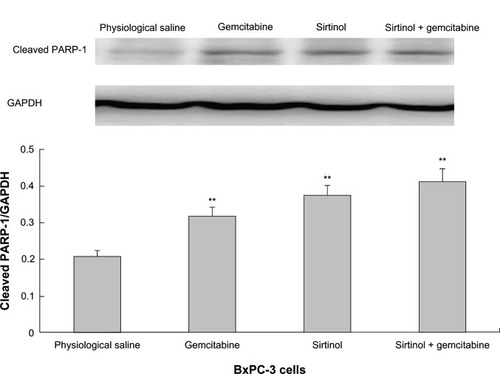
Figure 5 In vitro cleaved PARP-1 effect of drug in SW1990 cells.
Abbreviations: GAPDH, glyceraldehyde 3-phosphate dehydrogenase; PARP, poly ADP ribose polymerase.
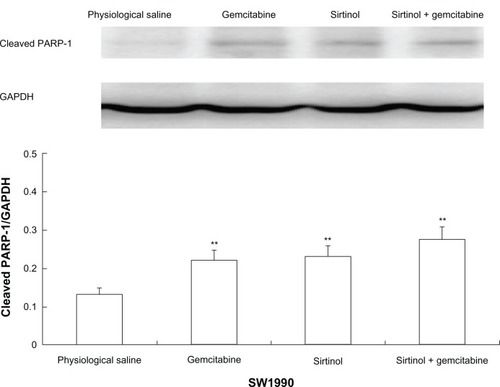
Figure 6 Tumor volume effect of different drug therapy.
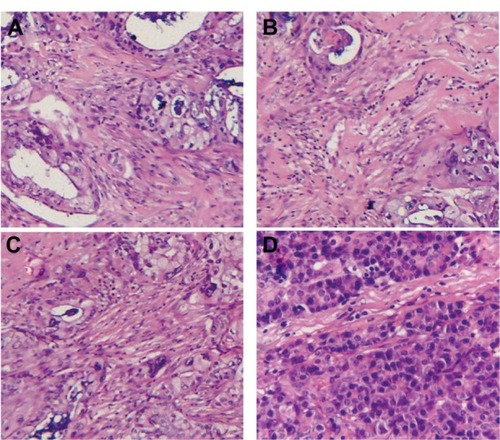
Notes: (A) Physiological saline. (B) Gemcitabine. (C) Sirtinol (inhibition of SIRT1). (D) Gemcitabine and sirtinol (inhibition of SIRT1). **P < 0.05; calculated by one-way analysis of variance test. Error bars represent the standard deviation for ten mice per group.
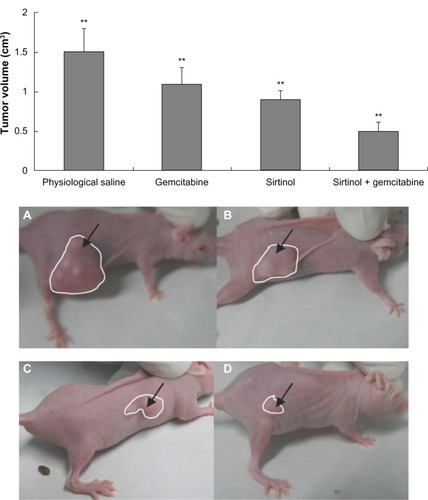
Figure 7 Improved therapeutic efficacy of sirtinol combined with gemcitabine in BxPC-3 pancreatic cancer xenograft mice for 45 days.
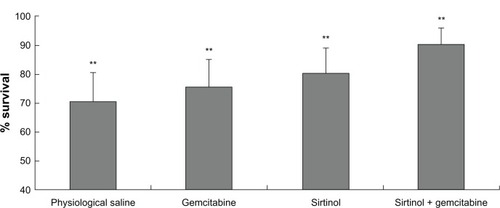
Figure 8 Hematoxylin and eosin assays of tumor tissues of the xenograft mice after various treatments.