
Figures & data
Table 1 Baseline Characteristics
Figure 1 Kaplan-Meier curves for the long-term prognosis of patients with CA-AKI and without CA-AKI. (A) Kaplan-Meier for the long-term prognosis of patients with CA-AKIA and without CA-AKIA. (B) Kaplan-Meier for the long-term prognosis of patients with CA-AKIB and without CA-AKIB.
Notes: CA-AKIA, which was defined as an increase of ≥0.5 mg/dL or >25% in serum creatinine from baseline within 72 hours after coronary angiography. CA-AKIB, which was defined as an increase of ≥0.3 mg/dL or >50% in serum creatinine from baseline within 48 hours after coronary angiography.
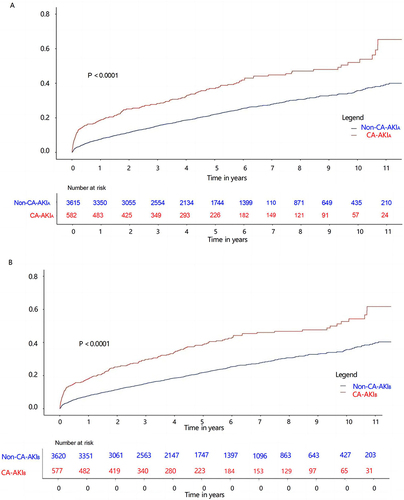
Table 2 Univariable Analysis of Risk Factors for Long-Term Mortality
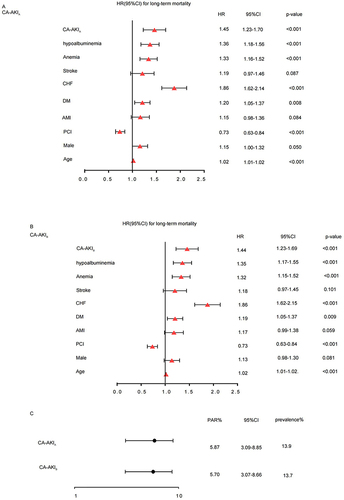
Figure 2 HR(95% CI) for long-term mortality. (A) HR(95% CI) for long-term mortality of CA-AKIA. (B) HR(95% CI) for long-term mortality of CA-AKIB. (C) The comparison of CA-AKIA and CA-AKIB.
Notes: CA-AKIA, which was defined as an increase of ≥0.5 mg/dL or >25% in serum creatinine from baseline within 72 hours after coronary angiography. CA-AKIB, which was defined as an increase of ≥0.3 mg/dL or >50% in serum creatinine from baseline within 48 hours after coronary angiography.
Abbreviation: PAR, the population attributable risk.
Data Sharing Statement
The dataset generated for this study is not publicly available, but is available from the corresponding author upon reasonable request.