Figures & data
Figure 1 Flow chart of study design.
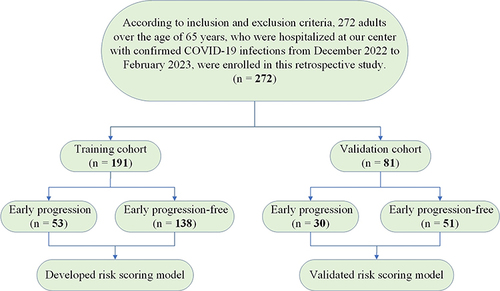
Table 1 Clinical Data of 272 Older Adult Patients Infected with Omicron Sub-Variants of COVID-19 with Early Progression or Progression-Free on Chest CT
Table 2 Univariable and Multivariable Logistic Regression to Identify Risk Factors for Older Adult Patients Infected with Omicron Sub-Variants of COVID-19 with Early Progression on Chest CT
Figure 2 Factors selection by LASSO regression. (A) A total of 9 factors with the smallest mean-squared error were initially selected (the dotted line on the left). To prevent overfitting and to simply the nomogram, 6 factors with no more than one-standard error were finally adopted (the dotted line on the right). (B) LASSO coefficient profiles of 18 factors. A vertical line was depicted at the selected log (λ) and 6 non-zero coefficients were screened.
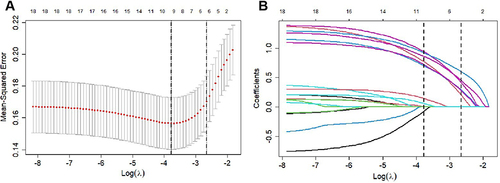
Figure 3 The nomogram to predict the risk for the early progression in older adult patients infected with Omicron sub-variants of COVID-19.
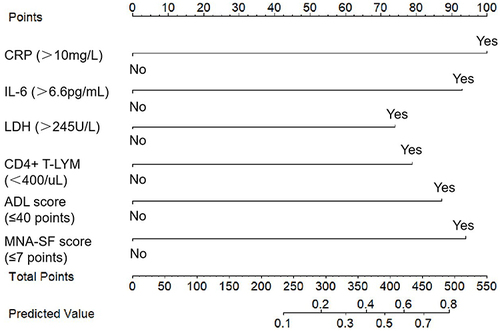
Figure 4 ROC curves of the nomogram to discriminate older adult patients of early-stage imaging progression in the training cohort (A), and validation cohort (B). After 1000 bootstrap resampling, ROC curves with the confidence interval of the Area Under Curve (AUC, blue shadow) in the training cohort (C), and validation cohort (D).
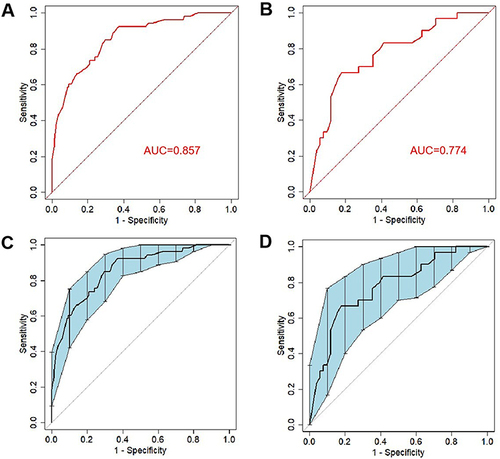
Figure 5 Calibration curves of the nomogram to predict older adult patients of early-stage imaging progression in the training cohort (A), and validation cohort (B). The ideal line (dotted line), apparent line (blue line), and bias-corrected line (red line) represented the ideal reference line, model calibration curve, and 500 bootstrap resampling, respectively.
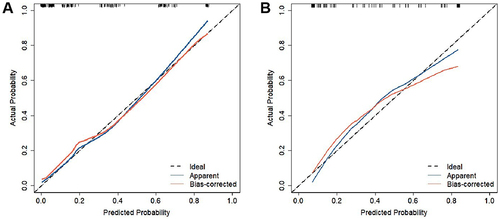
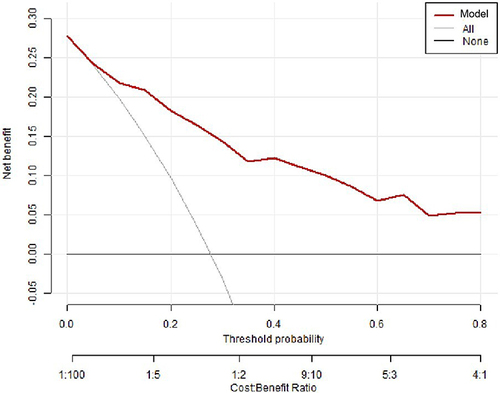
Figure 6 Decision curve analysis for the nomogram.