
Figures & data
Figure 1 Flow diagram of patients’ selection and exclusion.
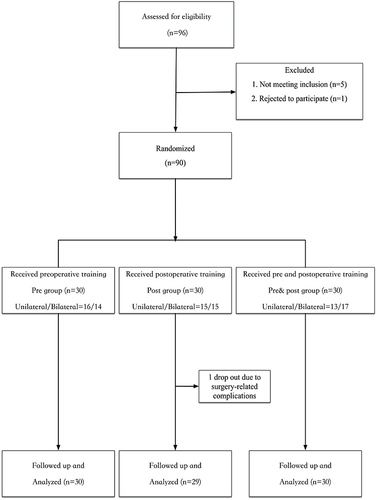
Figure 2 The enrolled patients underwent muscle strength training and testing, as well as gait and balance assessments. (a-c) Follow-up patients are undergoing Isokinetic Strength Assessment and Gait analysis. (d) Follow-up patients are undergoing Eyes-Closed Single-Leg Standing Balance Test.
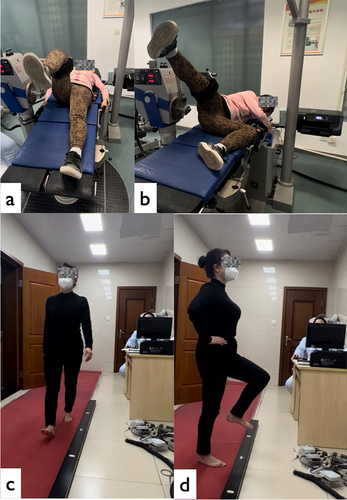
Table 1 Demographic Data of the Subjects
Table 2 Comparison of HMIT-NBM at Specific Time Points Among 3 Groups
Figure 3 (a-d) represent the changing trend of hip maximal isometric torque normalized for body mass(HMIT-NBM) in three groups of patients at different time points. (a) represents flexion HMIT-NBM; (b) represents extension HMIT-NBM; (c) represents abduction HMIT-NBM; (d) represents adduction HMIT-NBM. An asterisk (*) indicates a significant difference compared to the baseline value (pre-2w) within the group. For example, the Blue asterisk (*) denotes a significant difference at this time point compared to the pre-2w baseline value in the pre group.
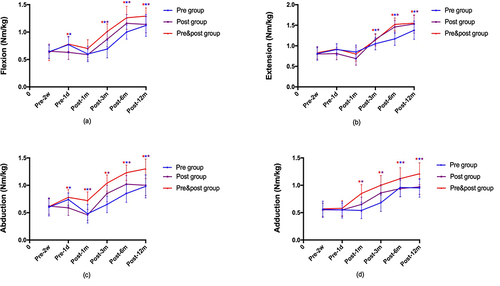
Table 3 Comparison of SLAR at Specific Time Points Among 3 Groups
Figure 4 The changing trend of Surgical Limb Advantage Ratio (SLAR) in three groups of patients at different time points. (a) represents flexion SLAR; (b) represents extension SLAR; (c) represents abduction SLAR; (d) represents adduction SLAR. An asterisk (*) indicates a significant difference compared to the baseline value (pre-2w) within the group. For example, the Blue asterisk (*) denotes a significant difference at this time point compared to the pre-2w baseline value in the pre group.
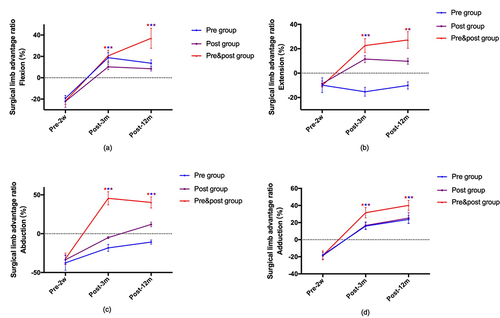
Table 4 Comparison of Gait Parameters at Specific Time Points Among 3 Groups
Figure 5 The changing trends of gait, balance indicators, and HHS scores in three groups of patients at different time points. (a) represents velocity; (b) represents cadence; (c) represents duration; (d) represents distance; (e) represents area; (f) represents HHS scores. An asterisk (*) indicates a significant difference compared to the baseline value (pre-2w) within the group. For example, the Blue asterisk (*) denotes a significant difference at this time point compared to the pre-2w baseline value in the pre group.
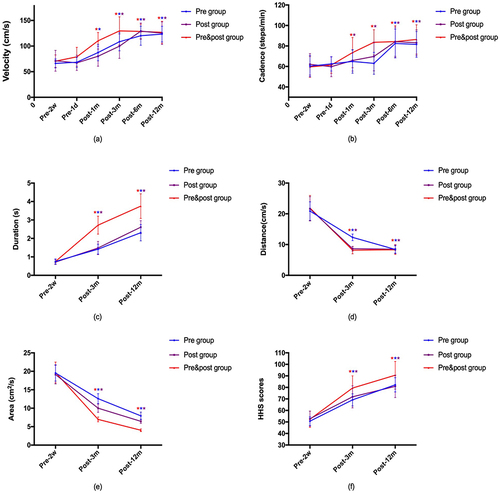
Table 5 Comparison of Balance Parameters and HHS Scores at Specific Time Points Among 3 Groups