Figures & data
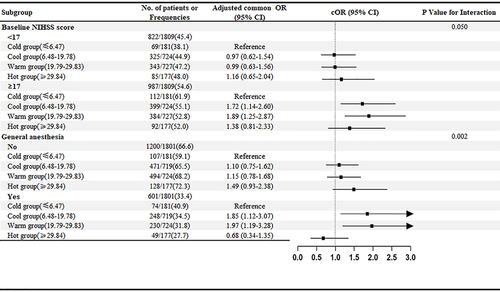
Figure 1 Flow of Patients in a study of the effect of temperature for patients with Endovascular Treatment. This study included 2011 patients with acute stroke and large vessel occlusion. However, 202 patients were excluded for different reasons: 182 received only standard medical treatment, while the remaining 20 patients had missing essential data. Therefore, the final sample size consisted of 1809 patients who underwent treatment for large vessel occlusion.
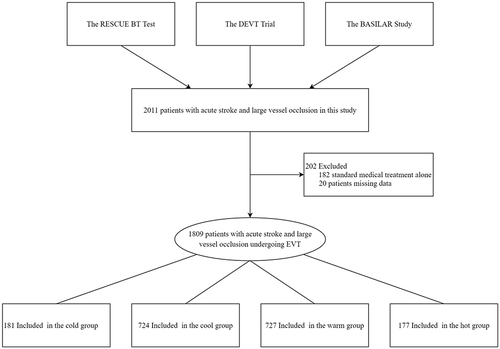
Table 1 Baseline Characteristics of the Study Population: Patients with Acute LVO
Table 2 Primary Outcomes and Secondary Outcomes
Table 3 Efficacy Outcomes and Safety Outcomes
Figure 2 Distribution of the modified Rankin scale score at 90 days of Cold, Cool, Warm, and Hot groups. The distribution of the modified Rankin scale score of primary outcomes in four groups derived on the temperature for all patients treated with endovascular treatment.
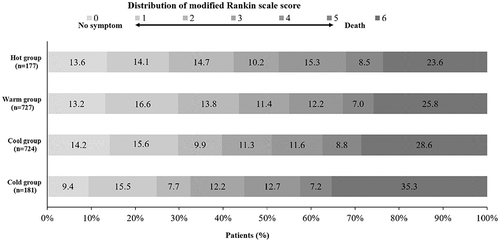
Figure 3 The forest plot displays effect variation across subgroups for the adjusted common odds ratio of less disability at 90 days as compared with the Cold group. The forest plot displays effect variation across 11 subgroups for the adjusted common odds ratio of less disability at 90 days. A lower modified Rankin Scale (mRS) score indicates less disability. The thresholds for age, baseline National Institutes of Health Stroke Scale score (NIHSS), and onset to recanalization time were chosen at the median. Adjusted odds ratio (95% CI) > 3 indicated by arrows.