
Figures & data
Table 1 Participant Characteristics at Baseline
Figure 1 First four components extracted from a functional principal components analysis of ActivPAL-measured steps per minute.
Notes: Lines represent principal component curves multiplied by approximately one standard deviation pooled across component scores that are added (orange) or subtracted (green) from the mean (blue).
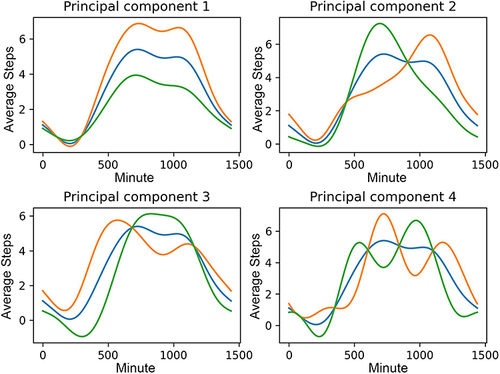
Table 2 Baseline Relationships Between the First Three Individual Component Scores, Health-Related Quality of Life, and Pain Symptoms
Table 3 Relationships Between the First Three Individual Component Scores at Baseline and 12-Week Change in Health-Related Quality of Life and Pain Symptoms, Adjusted for Baseline Scores