
Figures & data
Table 1 Incidence of Frailty at Different Time Points (n, %)
Figure 1 Incidence of frailty at different time points. The chi-square test and Fisher’s exact test were used to compare the incidence of frailty between groups.
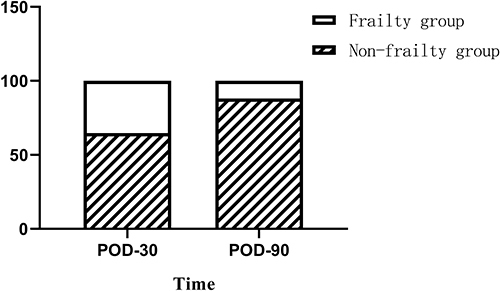
Table 2 Preoperative Analysis of Related Factors in the Two Groups of Patients (, %)
Table 3 Comparison of NRS Scores Between the Two Groups at Different Times M (P25, P75)
Table 4 Multivariate Logistic Regression Analysis of Frailty (n=102)
Figure 2 Frailty-related risk factors analysis. Logistic multivariate regression analysis was applied to analyze the risk factors associated with frailty, and the results showed that Age, BMI, and NRS1 were independent risk factors for postoperative frailty (P<0.05).
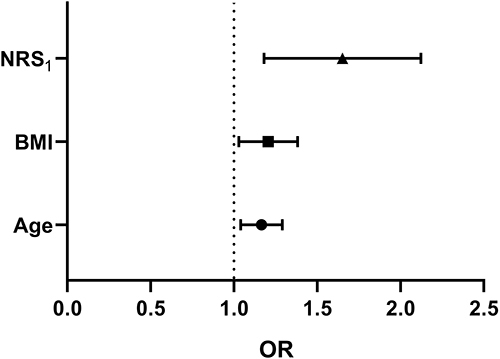
Table 5 Comparison of EQ-5D-5L Scores Between the Two Groups at Different Times ()
Figure 3 Comparison of EQ-5D-5L scores between the two groups at different time points. Repeated-measures ANOVA was applied to compare the differences in EQ-5D-5L scores between the two groups of patients at different time points.
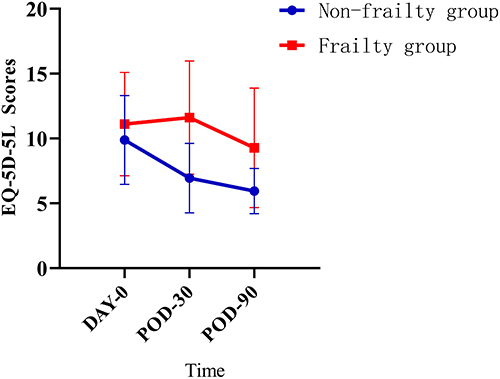
Table 6 Correlation Analysis of EQ-5D-5L Scores 30 Days After Surgery (n=102)
Table 7 Multiple Linear Regression of EQ-5D-5L at 30 Days After Surgery (n=102)
Data Sharing Statement
The datasets generated and analyzed during the current study are not publicly available due to limitations of ethical approval involving the patient data and anonymity but are available from the corresponding author upon reasonable request.