Figures & data
Table 1 Predicted and Observed Risks of ASCVD
Figure 1 The 10-year absolute CVD risk levels predicted by 3 models.
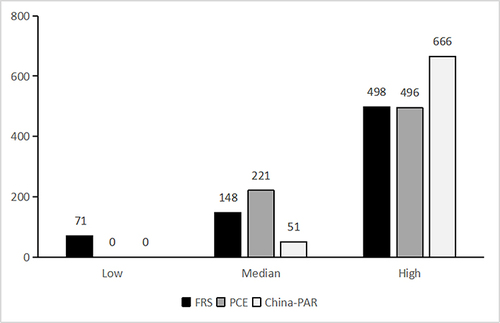
Figure 2 (A) Discrimination of the 3 equations in men. Framingham (man): AUC = 0.618 95% CI = 0.571–0.665. China-PAR (man): AUC = 0.778 95% CI = 0.737–0.820. PCE (man): AUC = 0.682 95 CI = 0.629–0.735. (B) Discrimination of the 3 equations in women. Framingham (woman): AUC = 0.815 95% CI = 0.747–0.882. China-PAR (woman): AUC = 0.815 95% CI = 0.752–0.878. PCE (woman): AUC = 0.774 95% CI = 0.703–0.845.
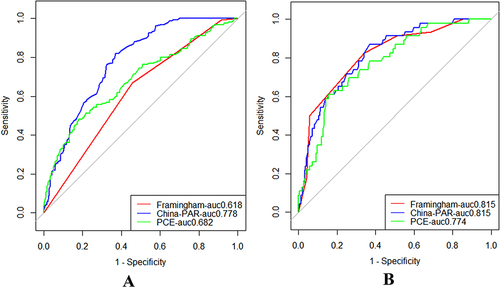
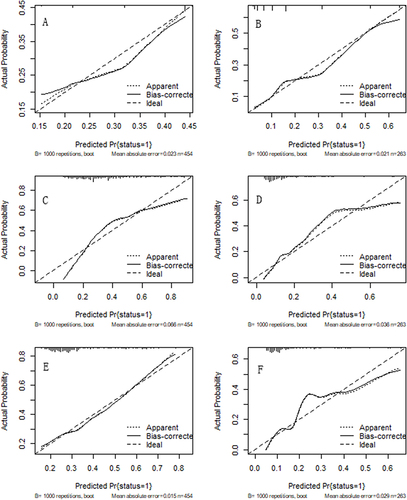
Figure 3 Calibration of the 3 equations. (A): X-squared = 1.3964, df = 8, P = 0.994. (B) X-squared = 13.523, df = 8, P = 0.095. (C) X-squared = 25.528, df = 8, P = 0.001. (D) X-squared = 6.1433, df = 8, P = 0.631. (E) X-squared = 7.9098, df = 8, P = 0.442. (F) X-squared = 8.3685, df = 8, P = 0.398.