Figures & data
Figure 1 Flow diagram of patient selection and grouping in this study.
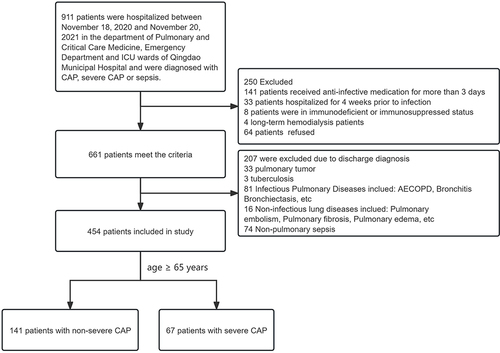
Table 1 Clinical Characteristics of Non-SCAP and SCAP Patients Before and After Propensity Score Matching Analysis
Figure 2 Serum LPC levels in elderly patients with CAP. (a) Serum LPC levels of patients in the non-SCAP (blue circles) and SCAP (red squares) groups on days 1. (b) Serum LPC levels of patients in the survivor (purple circles) and non-survivor (brown squares) groups on days 1. (c) Serum LPC levels of patients in the survivor and non-survivor groups on days 1 and 6 after treatment. The data are represented as the median value.
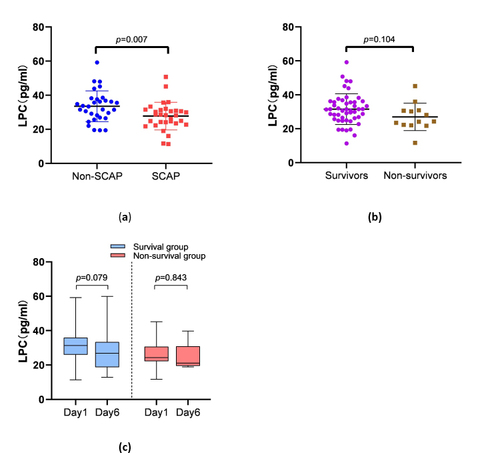
Table 2 Binary Logistic Regression Analysis of SCAP Incidence
Figure 3 ROC curve analysis shows the prediction performances of LPC, PSI score, CURB-65 score, LPC + PSI score, and LPC + CURB-65 score in discriminating between SCAP and non-SCAP patients.
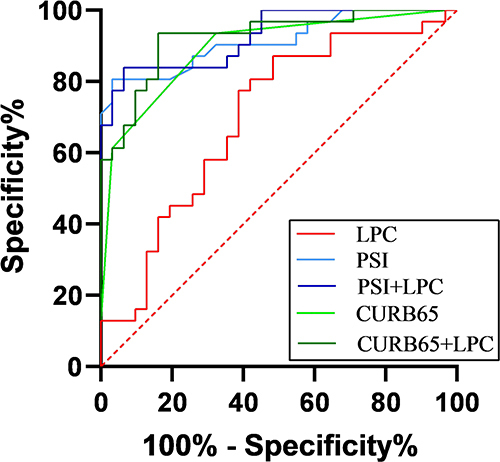
Table 3 Area Under the Curve Values and Thresholds of Different Parameters for Predicting the 30-Day Mortality in CAP Patients
Table 4 Cox Proportional Hazard Regression Analysis of Multiple Variables for Predicting the 30-Day Mortality of Elderly Patients with CAP
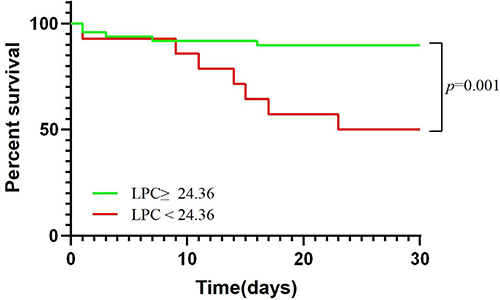
Figure 4 Kaplan–Meier survival curve analysis shows the 30-day mortality rates of elderly CAP patients stratified by high- or low-LPC levels using LPC concentration of 24.36 ng/mL as the cut-off value.