Figures & data
Table 1 Outcome, mortality rates, and relative risk of fragility hip fracture patients compared to controls at the first and fifth years after hip fracture in southern Norway in 2004–2005
Figure 1 Kaplan–Meier survival analysis in males and females with a fragility hip fracture in 2004–2005 in southern Norway compared to matched controls.
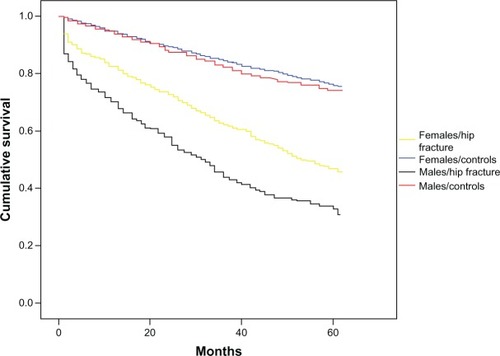
Figure 2 Kaplan–Meier survival analyses in males and females with a fragility hip fracture in 2004–2005 in southern Norway.
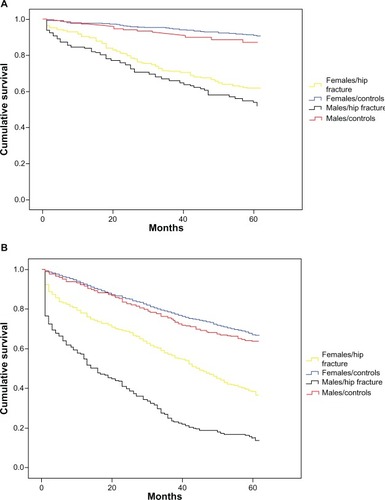
Figure 3 Kaplan–Meier survival analysis in patients with a fragility hip fracture in 2004–2005 in southern Norway (indicated with Yes) compared to matched controls (indicated with No).
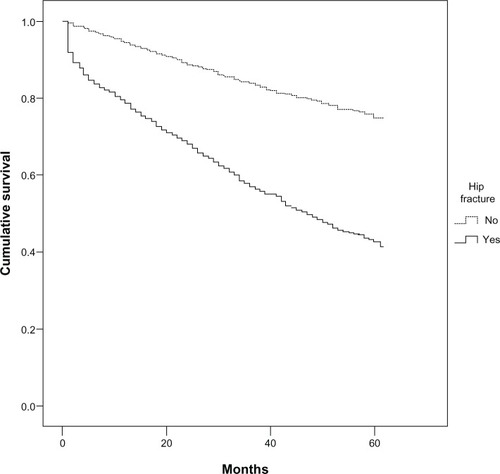
Table 2 Mortality OR estimates in relation to time since fracture in males and females compared to controls