
Figures & data
Figure 1 Flowchart of patients screened, recruited, and included in the final analysis.
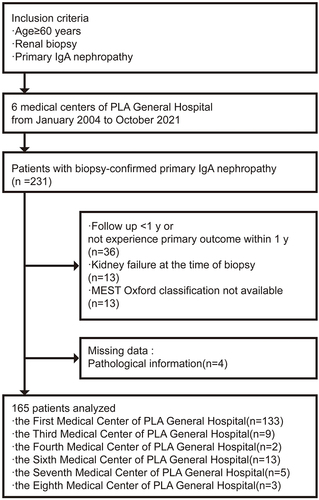
Table 1 Characteristics of Participants in the Older Adults Validation Cohort, the Original Derivation Cohort, and the Original Validation Cohort
Table 2 Concordance Statistics, Calibration Slopes, Net Reclassification Improvements, and Integrated Discrimination Improvements of Full Models in the Older Adults External Validation Cohort
Table 3 Associations of the Risk Groups with the Composite Outcome of 50% Decline in Estimated Glomerular Filtration Rate or Kidney Failure in Patients with Over 5-Year Follow-Up (n=165)
Figure 2 The Time-dependent receiver operating characteristic (ROC) curves and the Kaplan-Meier curves confirmed the excellent distinguishing ability of both full models.
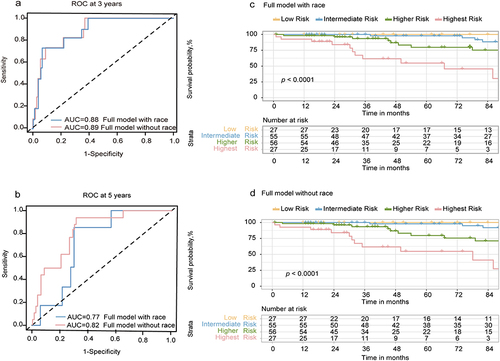
Figure 3 The full model without race more accurately prognoses the risk associated with primary outcomes in the older adult cohort.
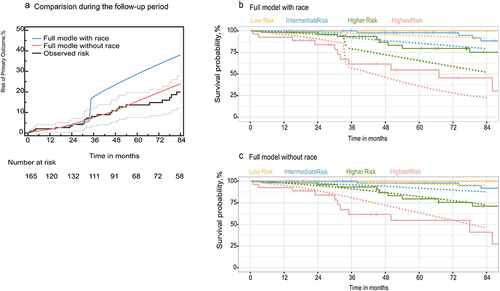
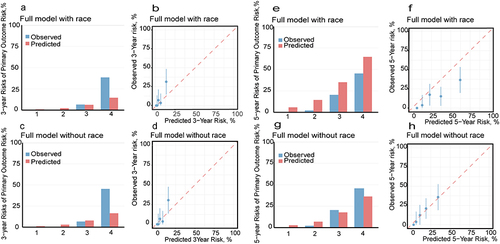
Figure 4 Calibration plots at 3 years for (a and b) the full model with race and (c and d) the full model without race, and at 5 years for (e and f) the full model with race and (g and h) the full model without race.
Data Sharing Statement
The raw data supporting the conclusions of this article will be made available by the authors without undue reservation. Correspondence and requests for materials should be addressed to Guang-yan Cai.