
Figures & data
Table 1 Comparisons of Baseline Information Between Two Groups
Table 2 Comparisons of Intraoperative Information Between Two Groups
Figure 1 The CONSORT flow diagram.
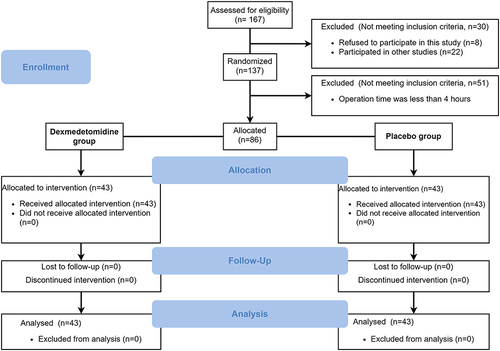
Figure 2 Changes in interleukin-6 (IL-6) and tumour necrosis factor-α (TNF-α) levels (primary outcomes).
Notes: The distribution of (A) IL-6 and (B) TNF-α in the placebo group (blue points) and the Dex group (yellow points) of all individuals are shown with violin plots (n=43 patients per group). Data are presented as violin plots with overlaid box plots. The bounds of the box show the interquartile range, and the centre line of the box shows the median. Vertical endpoints represent the 5th and 95th percentiles. Data are analyzed with the repeated measures analysis of variance (RMANOVA) followed by the LSD test for multi-comparison. *Significant difference with P<0.05 compared with the baseline in the Placebo group. **Significant difference with P<0.05 compared with the baseline in the Dex group. #Significant difference with P<0.05 compared with the Dex group at the corresponding time.
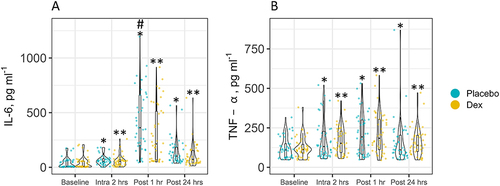
Table 3 Postoperative Clinical Outcomes in the Two Groups
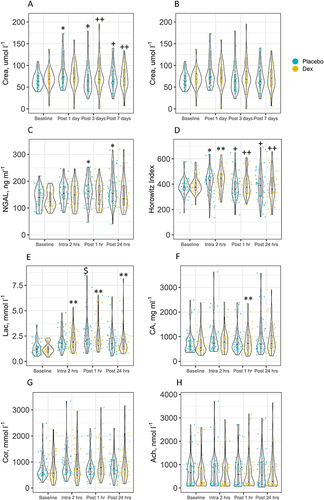
Figure 3 Assessment of renal function, pulmonary complications, and other biomarkers.
Notes: The distribution of (A) Crea, (B) BUN, (C) NGAL showing renal function, and (D) Horowitz Index and (E) cLac reflecting pulmonary complications, as well as other biomarkers of (F) CA, (G) Cor, and (H) Ach in the placebo group (blue points) and the Dex group (yellow points) of all individuals are shown with violin plots (n=43 patients per group). Data are presented as violin plots with overlaid box plots. The bounds of the box show the interquartile range, and the centre line of the box shows the median. Vertical endpoints represent the 5th and 95th percentiles. Data are analysed with the repeated measures analysis of variance (RMANOVA) followed by the LSD test for multi-comparison. *Significant difference with P<0.05 compared with the baseline in the placebo group. **Significant difference with P<0.05 compared with the baseline in the Dex group. +Significant difference with P<0.05 compared with the placebo group at the corresponding time. ++Significant difference with P<0.05 compared with the Dex group at the corresponding time. $Significant difference with P<0.05 compared with the other 3 time points (Baseline, Intra 2 hrs, and Post 24 hrs) in the Placebo group.
Data Sharing Statement
The datasets used and/or analyzed during the current study are available from the corresponding author upon reasonable request.