
Figures & data
Figure 1 Patient recruitment flow chart.
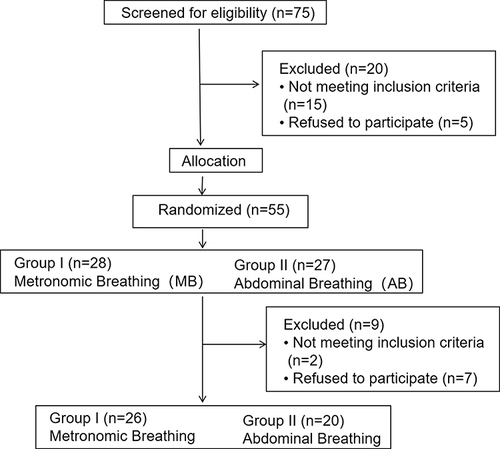
Table 1 Baseline Characteristics of All Patients
Table 2 Baseline Parameters of Hemodynamics and SF-36 Scores
Table 3 Comparison of Hemodynamic Indices Before and After in Two Groups
Figure 2 Comparison of treatment effects between the two groups after three months. Compared to the control group, the MB group exhibited significant increases in SV, SVI, CO, CI, and VI (A-D and G) and significant decreases in SVR, SVRI, and SBP (I-K) (P < 0.05). Although the MB group had greater LCW, LCWI, and ACI, no significant differences were detected (P > 0.05) (E, F and H). Furthermore, there were no significant changes in HR or DBP for either group of patients after the intervention (L and M). The data are expressed as the mean ± SD. *: P < 0.05, Ns: P > 0.05.
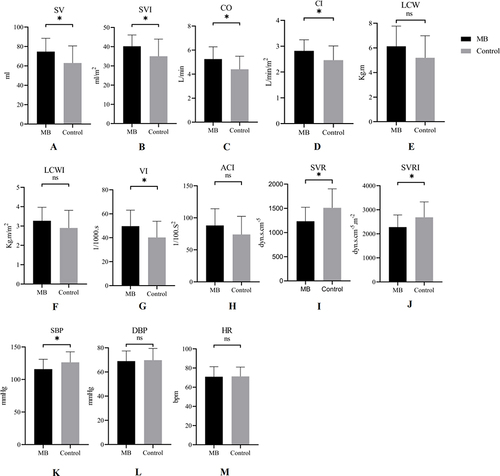
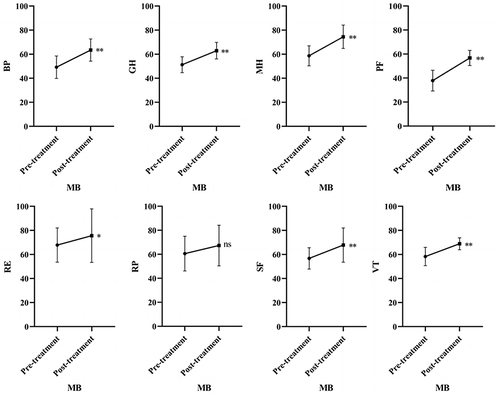
Figure 3 Comparison of SF-36 scores after three months in the MB group. SF-36 scores after three months of MB rehabilitation intervention, PF, BP, GH, VT, SF, RE, and MH, were all significantly greater than those before treatment (P <0.05) (Figure 3). Although the SF-36 score increased more in the RP group than in the pretreatment group, the difference was not statistically significant (P> 0.05) (Figure 3). The data are expressed as the means ± SDs. *: P < 0.05, **: P < 0.005, Ns: P > 0.05.
Data Sharing Statement
The raw data supporting the conclusions of this article will be made available by the authors without undue reservation.