Figures & data
Figure 1 RoboTherapist 2D robotic device used in this study to monitor the reaching task.
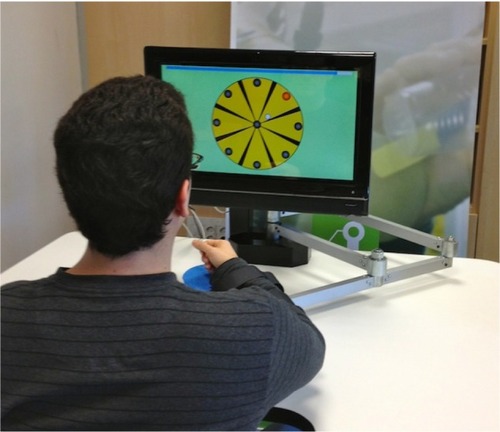
Figure 2 A participant grasping the robot end effector in the setup position.
Figure 3 Targets and feedback presented to the participant using the REVIRE software.
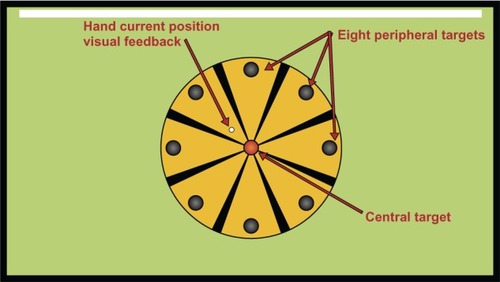
Table 1 Participants: summary demographic data
Figure 4 Movement parameters calculated from position data recorded by the RoboTherapist 2D robotic device as described in Coderre et al.Citation5
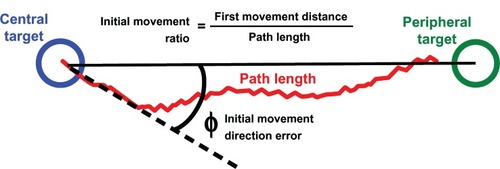
Figure 5 Movement parameters calculated from tangential velocity data recorded by the RoboTherapist 2D robotic device as described in Coderre et al.Citation5
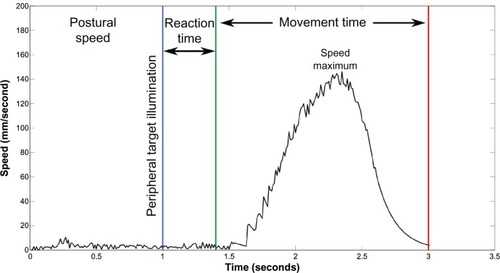
Table 2 Descriptive statistics, median, skewness, and kurtosis for the three age groups
Figure 6 Hand trajectories for a 67-year old, right handed, male (#38).
Notes: Hand trajectories are plotted for movements made to each of the eight targets and speed profiles are plotted for one movement direction. The dominant arm is on the left (A and C) and the non-dominant arm is on the right (B and D). Each line in the hand trajectory (A and B) and speed profile (C and D) plots represents a single trial. The blue vertical line in the speed profiles represents the time when the peripheral target was illuminated.

Figure 7 Hand trajectories for a 23-year-old, right handed, male (#5).
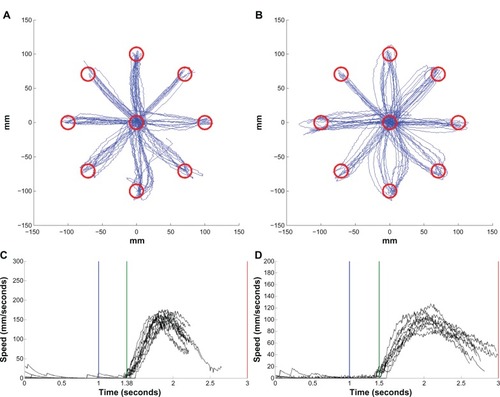
Table 3 Kruskal–Wallis test, dominant arm
Table 4 Kruskal–Wallis test, non-dominant arm
Table 5 Pairwise comparisons of the different parameters of the dominant arm using the Mann–Whitney U test
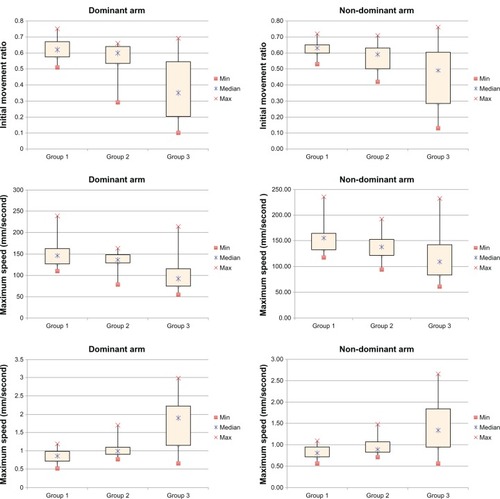
Figure 8 Significant movement parameters plotted for the three groups.