
Figures & data
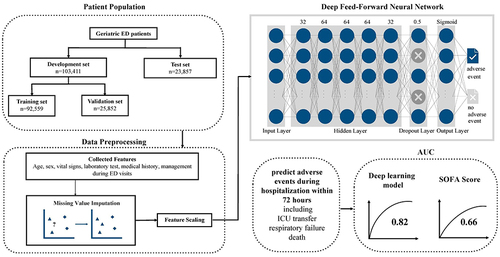
Figure 1 Patient inclusion flow chart and the development of the deep learning model.
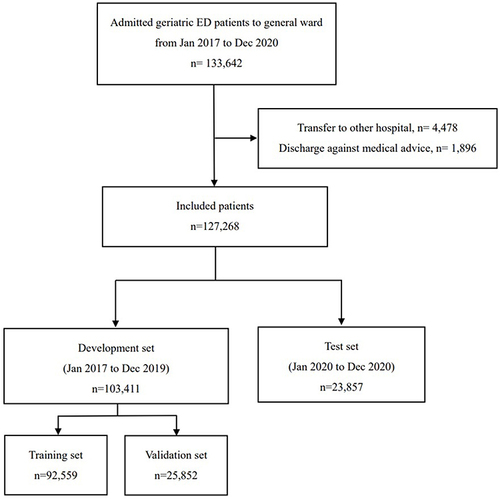
Table 1 Characteristics of Patients in Development and Test Data Set
Table 2 Clinical Features Associated with Adverse Event During Admission
Figure 2 The Receiver Operating Characteristic (ROC) curve of model prediction.
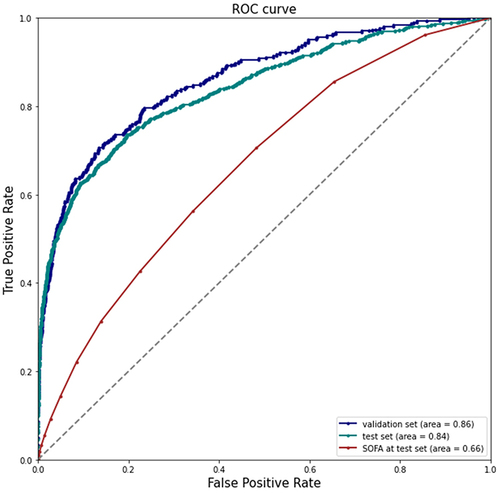
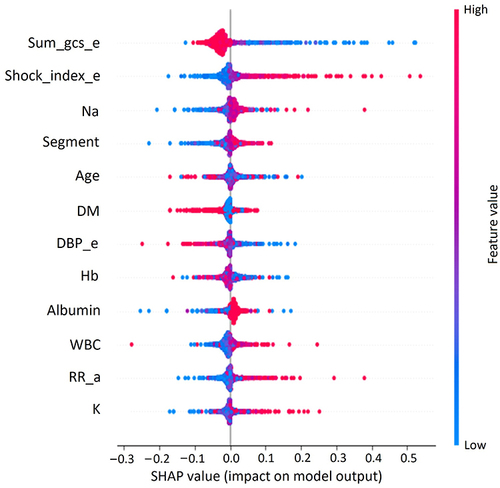
Figure 3 Global Explanation of feature importance by SHapley Additive exPlanations (SHAP) value. Sum_gcs_e: The sum of the Glasgow Coma Scale scores when the patient left the emergency department to ward admission. Shock_index_e: Shock index (dividing the heart rate by the systolic blood pressure) when the patient left the emergency department to ward admission.
Data Sharing Statement
The datasets used and/or analyzed during the current study are available from the corresponding author upon reasonable request.