Figures & data
Figure 1 Flow diagram for screening patients.
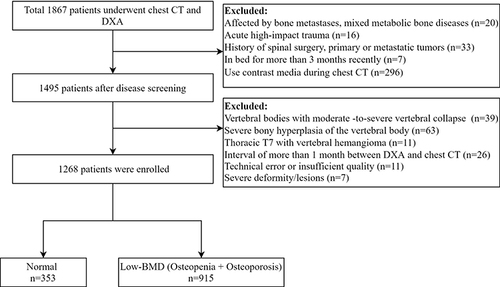
Figure 2 The 7th thoracic vertebra was located and the CT value of mid-sagittal plane was measured in the region of interest (ROI).
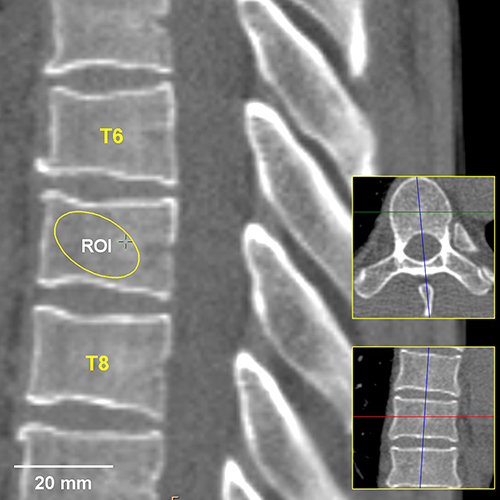
Table 1 Baseline Characteristics
Figure 3 Scatter plot of the distribution of CT values and T-score. (a–d) show the different groups by sex, age height, and weight, respectively.
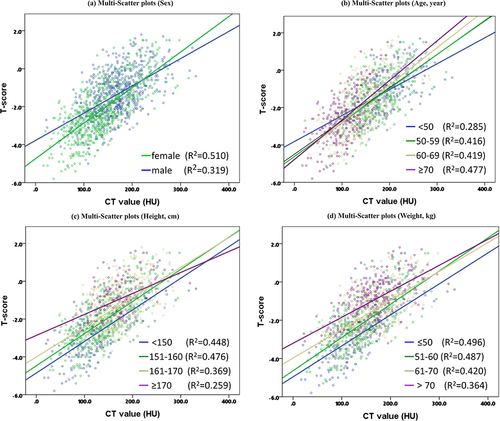
Table 2 Multivariate Logistic Regression Analysis
Table 3 The Performance of Predicting Low Bone Mineral Density Using Receiver Operating Characteristic (ROC) Curves Analysis
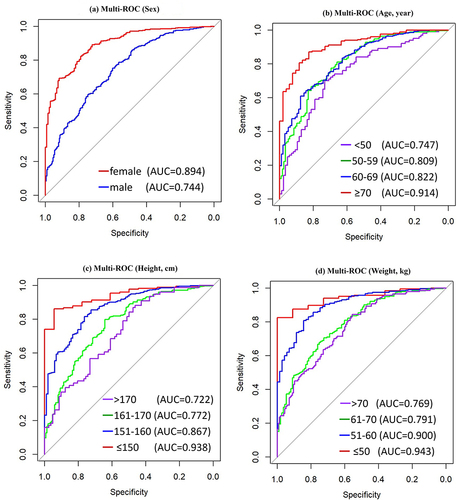
Figure 4 The receiver operating curve (ROC) curves of CT values in the diagnostic efficacy of low-BMD. (a–d) show the different groups by sex, age height, and weight, respectively.