Figures & data
Figure 1 Left atrial (LA) voltage mapping from 2 patients. The area of voltage <0.5 mV was used to define scar tissue (<0.5 mV – red, green, and blue on the map) and normal tissue (>0.5 mV – purple on the map). A1 and B1 were in the anteroposterior (AP) projection. A2 and B2 were in the posteroanterior (PA) projection. Patient 1 (A1-A2) had better substrate in LA, and the LVA (30.6%) was limited. Patient 2 (B1-B2) had widespread LVA (79.2%).
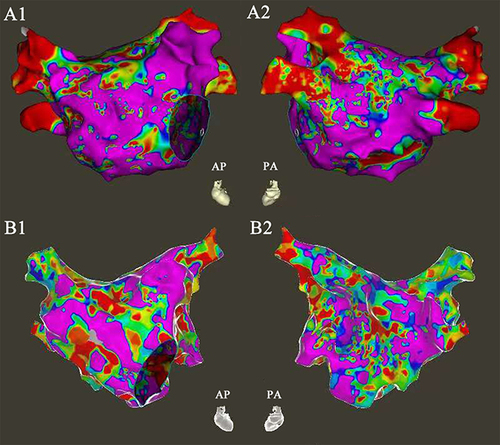
Table 1 Demographic and Clinical Characteristics of Patients [n (%), ]
Figure 2 Change trend of bilirubin before and after RFCA.
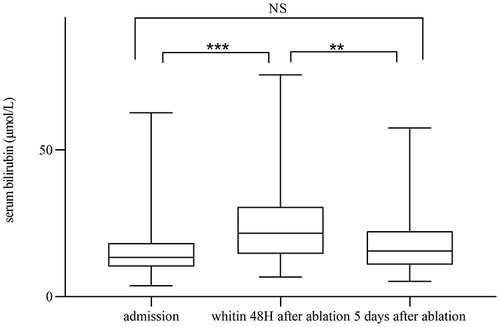
Table 2 Multiple Linear Regression Analysis of Total Bilirubin Levels in AF Patients
Table 3 Recurrence of Atrial Fibrillation in the Two Bilirubin Ratio Groups
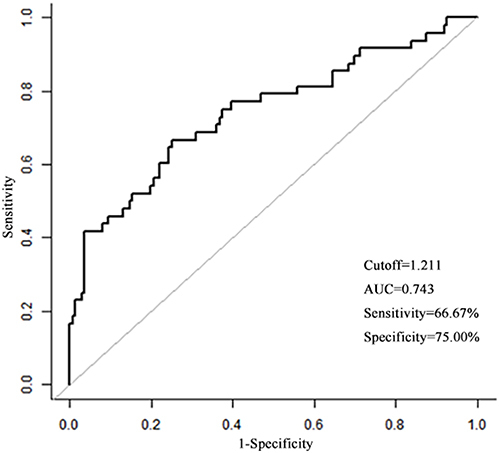
Figure 3 The cutoff for the ratio of total bilirubin to predict atrial fibrillation recurrence by receiver operating characteristic (ROC) analysis.