Figures & data
Table 1 Main intervention components and their frequency per group-based intervention
Figure 1 Flowchart of the study.
Abbreviations: CG, control group; IG, intervention group; GP, general practitioner; T0, baseline; T1, after the intervention.
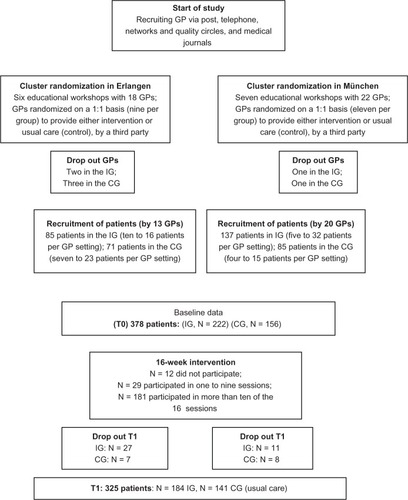
Table 2 Demographic variables of participants at baseline
Table 3 Results of the random intercept and random slope model for the short-term effects of the intervention on the secondary outcomes
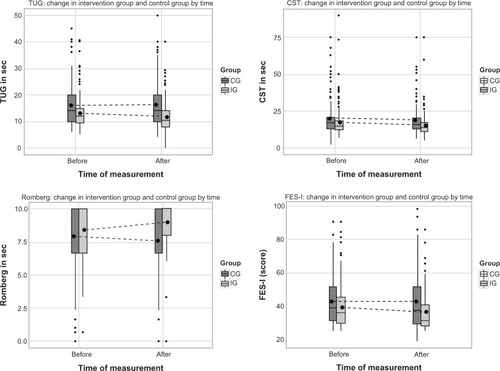
Figure 2 Change in physical and psychological outcomes before and after the intervention.
Abbreviations: CG, control group; CST, Chair Stand Test; FES-I, Falls Efficacy Scale – International; IG, intervention group; TUG, Timed-Up-and-Go test.