
Figures & data
Figure 1 The flow chart of participants inclusion.
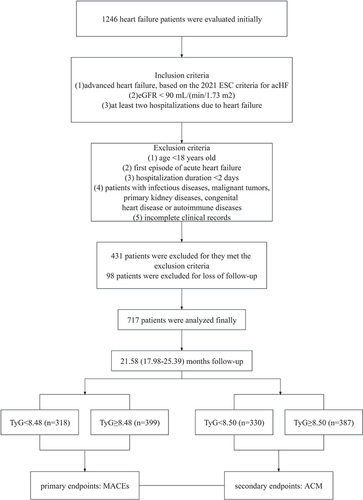
Table 1 Clinical and Laboratory Characteristics According to the TyG (MACEs)
Figure 2 ROC curve of TyG predicting long‐term MACEs in patients with advanced chronic heart.
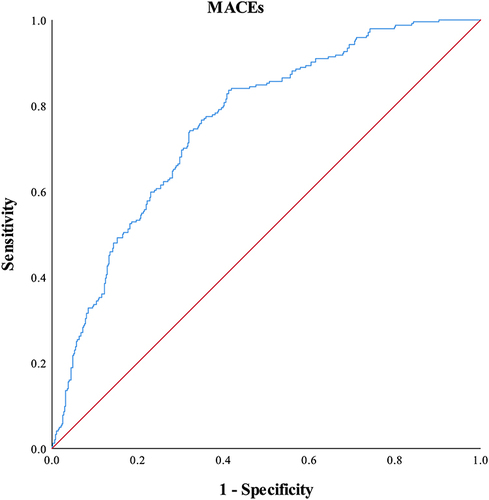
Table 2 Clinical and Laboratory Characteristics According to the TyG (ACM)
Figure 3 ROC curve of TyG predicting long‐term ACM in patients with advanced chronic heart failure with renal dysfunction.
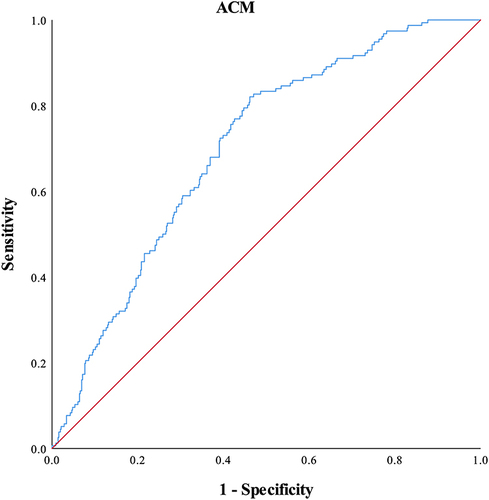
Table 3 Univariate COX Regression Analysis Results for MACEs
Table 4 Univariate COX Regression Analysis Results for ACM
Table 5 Multivariate Cox Regression Analysis Results for MACEs
Table 6 Multivariate Cox Regression Analysis Results for ACM
Figure 4 Kaplan–Meier curves for survival analysis of MACEs-free survival (Log rang p<0.001).
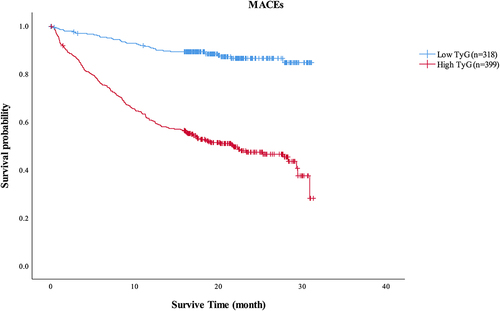
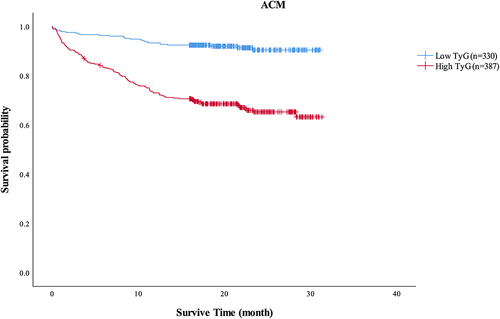
Figure 5 Kaplan–Meier curves for survival analysis of ACM-free survival (Log rang p<0.001).
Data Sharing Statement
The data that support the findings of this study are available on request from the corresponding author, upon reasonable request.