
Figures & data
Table 1 Baseline Characteristics of the Cohort by Treatment Modality and Estimated Glomerular Filtration Rate (eGFR) Category
Figure 1 Flowchart of patient inclusion. This figure shows the enrollment information of patients in the present study.
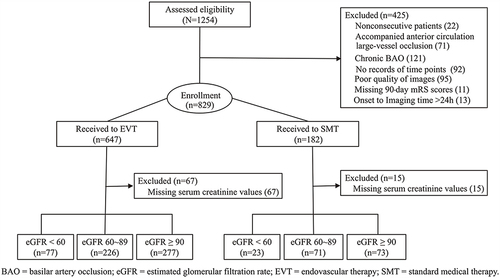
Table 2 Associations Between Baseline Estimated Glomerular Filtration Rate Categories and Clinical Outcome at 3 Months
Figure 2 Association of eGFR with clinical outcomes. A restricted cubic splines curve with 3 knots illustrating the association of the baseline eGFR with mortality and favourable outcome in (A). The interaction effect of EVT on favourable outcome in (B). The estimated probabilities of a favourable outcome and mortality by treatment modality according to baseline eGFR are presented in (C and D). The EVT group had an increased estimated probability of favourable outcome and decreased estimated probability of mortality than the SMT group as the eGFR increases.
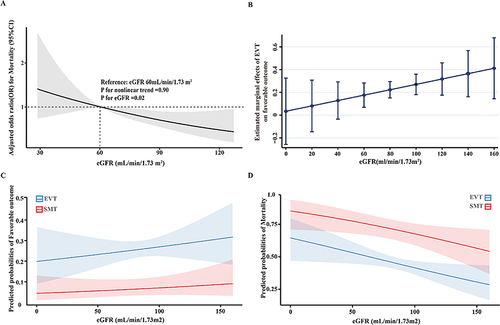
Figure 3 Distribution of the modified Rankin Scale (mRS) scores at 90 days. This figure shows the 90-day mRS scores distributions stratified by treatment modality in all patients according to the eGFR categories.
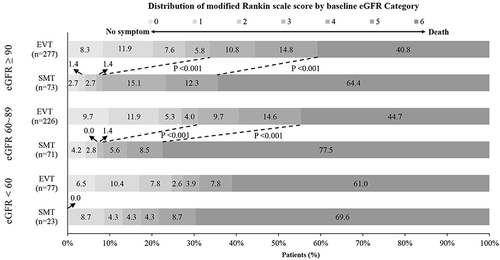
Figure 4 Effect of EVT according to baseline eGFR categories. Reported odds ratios are adjusted for age, sex, AF, baseline NIHSS, pc-ASPECTS, stroke etiology, and occlusion site.
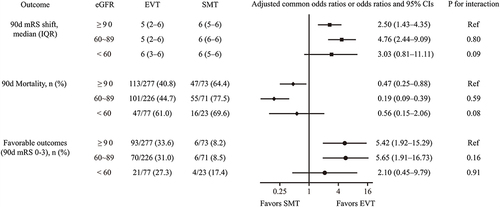
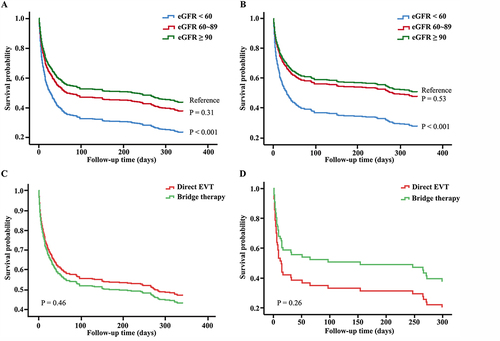
Figure 5 Cumulative survival probability for patients. Cumulative survival curves were plotted according to baseline eGFR categories in all patients (A) and patients with EVT (B). Cumulative survival curves were plotted according to IVT in all patients (C) and patients with RI (D).
Data Sharing Statement
The data that support the findings of this study are available on reasonable request from the correspondence author after approval of the ethics committee and all participating centres.