Figures & data
Figure 1 Flow chart.
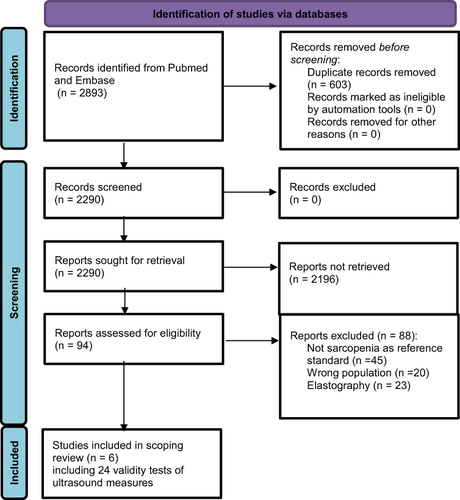
Table 1 Characteristics of Included Studies (n = 6)
Table 2 Results of Validity Tests (n = 24)
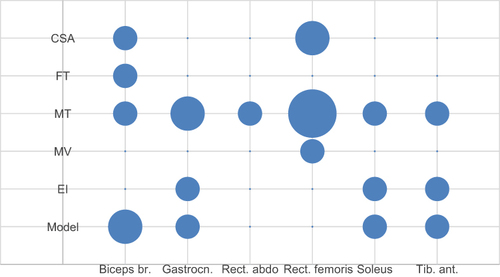
Figure 2 Bubble chart presenting the number of validity tests performed for each muscle and muscle parameter* (n=24).
Notes: *The area of the bubble represents the number of validity tests that were performed for the type of muscle and muscle parameter, respectively. The size of the following bubble equals  n = 1 validity test.
Abbreviations: Biceps br., Biceps brachii; Gastrocn., Gastrocnemius; Rect. Abdo, Rectus abdominis; Rect. Femoris, Rectus femoris; Tib. ant., tibialis anterior; MT, Muscle thickness; CSA, cross-sectional area; MV muscle volume; EI, Echointensity, FT, Fat thickness; Model, Models entail equations (eg, MT/EI Index) that were established by the study teams to predict sarcopenia (Details in ).