Figures & data
Table 1 Demographic characteristics of participants (means ± standard deviation)
Table 2 Mood measurements (means ± standard deviation) for POMS before and after walking
Table 3 sAA activities and WCST scores (means ± standard deviation) before and after walking
Figure 1 Scatter plots of the correlations between ΔsAA and ΔTE on the WCST.
Notes: A significant correlation between ΔsAA and ΔTE was found**** (ρ = 0.516, P < 0.05). ΔsAA = prewalking and postwalking changes in sAA activities. ΔTE = prewalking and postwalking changes in TE on the WCST.
Abbreviations: sAA, salivary α-amylase; TE, total errors; WCST, Wisconsin Card Sorting Test.
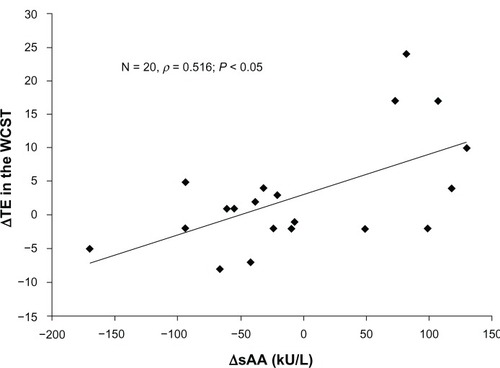
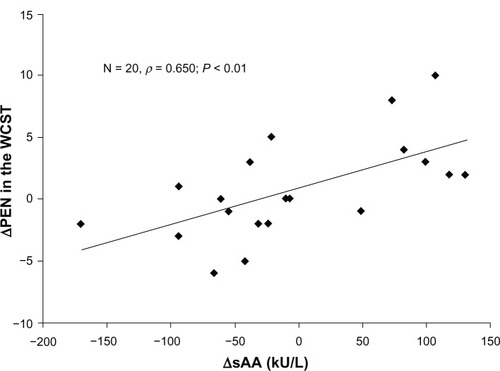
Figure 2 Scatter plots of the correlations between ΔsAA and ΔPEN on the WCST.
Notes: A significant correlation ΔsAA and ΔPEN was found (ρ = 0.650, P < 0.01). ΔsAA = prewalking and postwalking changes in sAA activities. ΔPEN = prewalking and postwalking changes in PEN of the WCST.
Abbreviations: sAA, salivary alpha-amylase; PEN, perseverative errors of Nelson; WCST, Wisconsin Card Sorting Test.
Abbreviations: sAA, salivary alpha-amylase; PEN, perseverative errors of Nelson; WCST, Wisconsin Card Sorting Test.