Figures & data
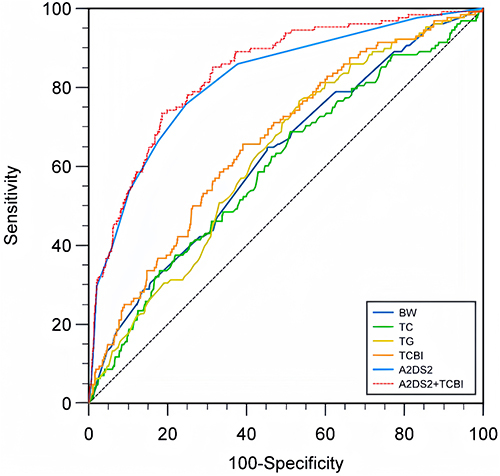
Figure 1 Patient flowchart.
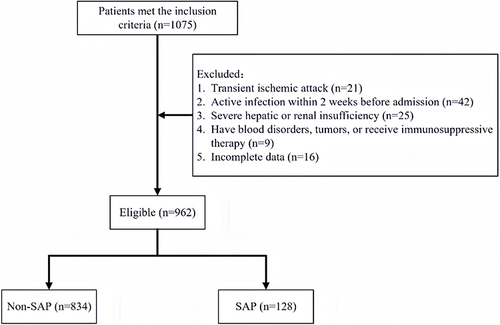
Table 1 Comparison of Baseline Data Between SAP Group and Non-SAP Group
Table 2 Baseline Characteristics of Patients According to TCBI Tertiles
Figure 2 Forest plot of odds ratios for SAP.
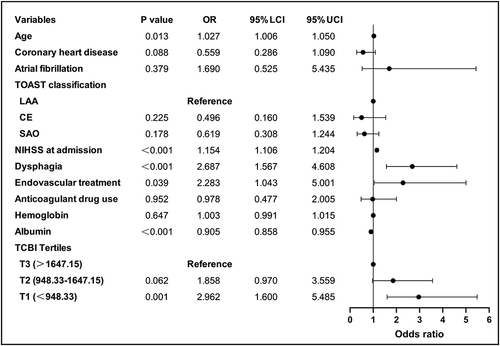
Figure 3 Association of TCBI with risk of stroke-associated pneumonia. Odds ratios and 95% confidence intervals derived from restricted cubic spline regression, with knots placed at the 5th, 35th, 65th, and 95th percentiles of the distribution of Log TCBI. The reference point is the median of Log TCBI. Odds ratios were adjusted for the same variables as model in. .
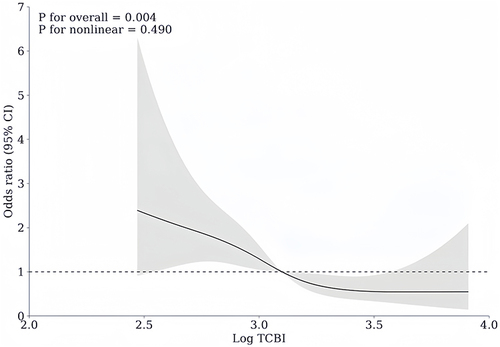
Table 3 Comparison of Predictive Power of TCBI Vs Other Indicators in the Prediction of SAP
Figure 4 Comparison of AUROC of TCBI with other biomarkers for predicting SAP.