Figures & data
Table 1 Baseline characteristic according to intervention group
Table 2 Profile of anthropometry and body composition at baseline, 6 weeks, and 12 weeks of intervention, according to intervention group
Table 3 Functional fitness test at baseline, 6 weeks, and 12 weeks of intervention, according to intervention groups
Figure 1 Percent changes in Chair Stand Test results, in the different intervention groups during the 12-week intervention.
Notes: Values are expressed as mean ± SD. *Significant differences at P < 0.05 from baseline.
Abbreviations: CG, control group; ExG, exercise group; ExG+PrG, combined exercise and protein supplementation group; PrG, protein suplementation group; SD, standard deviation; s, seconds.
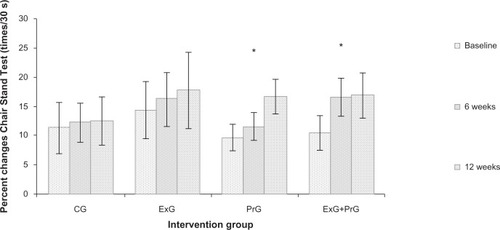
Figure 2 Percent changes in Arm Curl Test results, in the different intervention groups during the 12-week intervention.
Notes: Values are expressed as mean ± SD. *Significant differences at P < 0.05 from baseline.
Abbreviations: CG, control group; ExG, exercise group; ExG+PrG, combined exercise and protein supplementation group; PrG, protein suplementation group; SD, standard deviation; s, seconds.
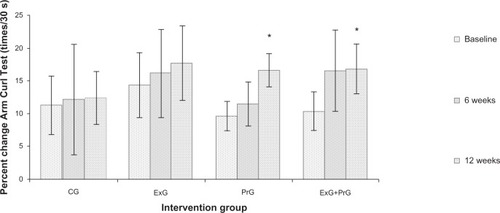
Figure 3 Percent changes in 8-Foot Up and Go Test results, in the different intervention groups during the 12-week intervention.
Abbreviations: CG, control group; ExG, exercise group; ExG+PrG, combined exercise and protein supplementation group; PrG, protein suplementation group; SD, standard deviation.
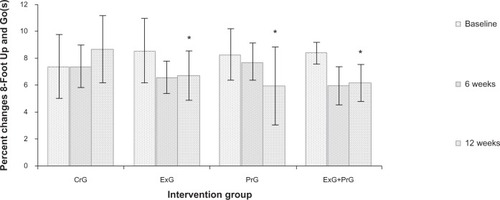
Table 4 Measurement of oxidative stress markers at baseline, 6 weeks, and 12 weeks, according to intervention group